Choose your language
It looks like you may prefer another language. Pick one to continue.
Sprint Reports & Agile Analytics for
Scaled Teams
Complete visibility into every sprint, every team, and every
increment, without switching tools or chasing data.
Thousands of happy clients worldwide





One Analytics Workspace. Five Views That Matter.
Kendis Analytics consolidates that picture into one reporting workspace, from the PI level all the way down to individual sprints.
PI Overview
Measure Sprint Delivery Against Commitments
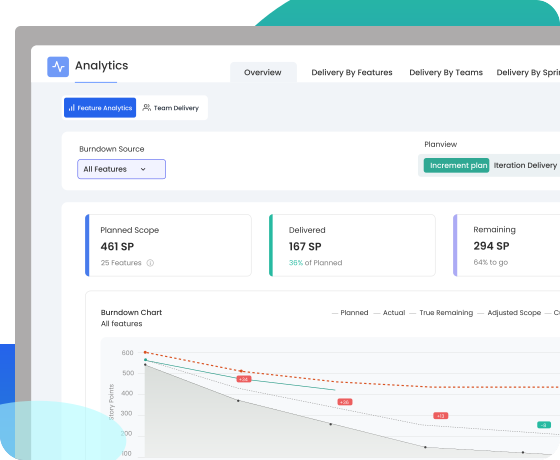
The Summary view shows planned vs. actual story points completed across the entire PI. The interactive charts display multiple data lines, Plan, Actual, Committed Load, Tracking Load, Planning Load, and Capacity, so you can see at a single glance whether execution is tracking to plan.
Delivery by Features
Feature Progress, Scope Changes, and Delivery Variations
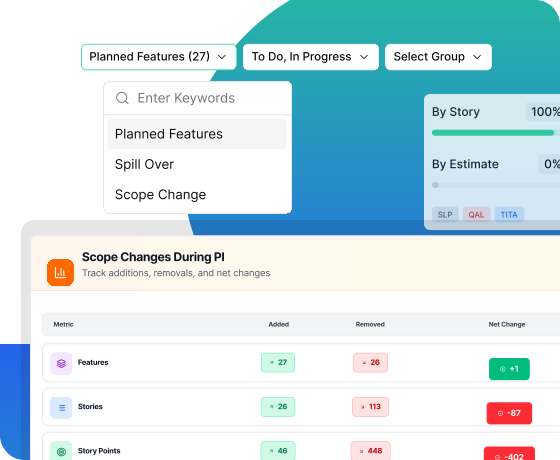
Visualize how individual features are tracking and what changed after planning ended. View unplanned Items, scope changes and feature delivery variations at a glance.
Delivery by Teams
Team Level Performance and Commitment Reliability
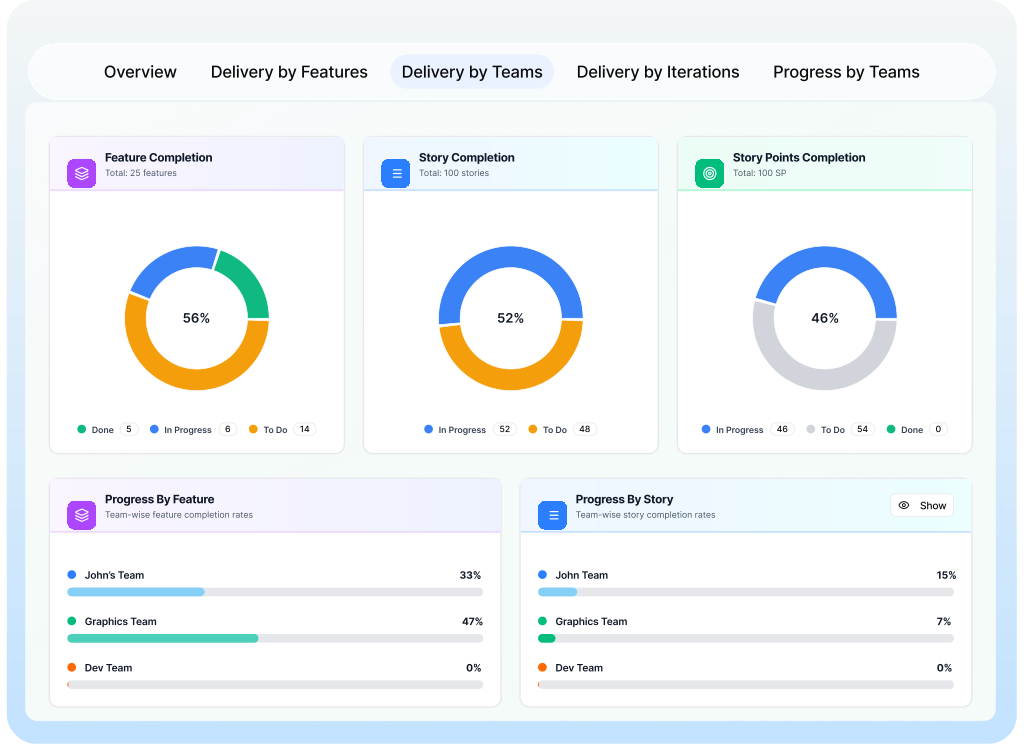
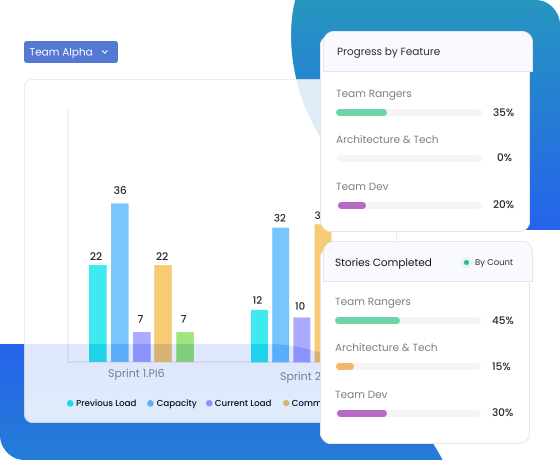
Shift the lens from features to teams, viewing how each ART team is tracking against their committed load. The team metrics table compares capacity, load, and capacity Load per team per sprint.
Charts
Burn Down & Burnup Charts
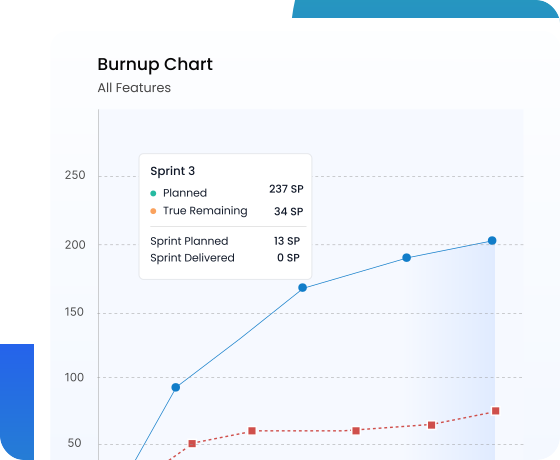
Kendis Analytics includes both chart types, switchable within the Feature Analytics and Team Delivery views. The burndown chart shows remaining work decreasing over iterations while the burnup chart shows completed work increasing over time alongside total planned scope.
Fully Customizable to Your Workflow. Synced with Your ALM Stack
Kendis integrates natively with the tools your teams already use with a powerful bi
directional sync. Analytics calculation criteria are fully configurable by Super Admins.