Flow metrics in 60 seconds
- SAFe has six: flow distribution, velocity, time, load, efficiency and predictability.[1]
- The Flow Framework has five: the same without predictability.[2]
- Kanban has four: WIP, throughput, work item age and cycle time.[3]
- They are linked: more work in progress means longer waits. That is Little's Law.[4]
- The lever: reduce flow load first. It is the one you control directly.
What are flow metrics?
Flow metrics are measures of how work items move from start to finish through a team, train or portfolio. They describe the system, not the people in it, and they are used to find where work waits so that delivery can be made faster and more predictable.
SAFe defines flow as "a smooth, linear, and fast movement of work product from step to step in a value stream"[5], and puts it at the centre: "Delivering a continuous flow of value to customers in the 'shortest sustainable lead time' is the central theme of SAFe."[6] Flow is one of three measurement domains in SAFe, alongside outcomes and competency.[1]
The term comes from Mik Kersten's Flow Framework, which measures the flow of four kinds of work item: features, defects, risks and debts.[2]
What are the six flow metrics?
The six SAFe flow metrics are flow distribution, flow velocity, flow time, flow load, flow efficiency and flow predictability.
| Metric | SAFe definition | What to look for |
|---|---|---|
| Flow velocity | "Measures the number of completed work items over a time period."[5] | A stable or rising trend. Sudden drops point to a blockage. |
| Flow time | "A measure of the time elapsed from start to completion for a given work item."[5] | Shorter and, more importantly, less variable. |
| Flow load | "A measure of the number of work items currently in progress (active or waiting)."[5] | Lower is usually better. Rising load predicts longer flow time. |
| Flow efficiency | "The ratio of the total time spent in value-added work activities divided by the total flow time."[5] | Low efficiency means work spends most of its life waiting. |
| Flow distribution | "A measure of the proportion of work items by type in a system."[5] | A deliberate balance between features and the rest. |
| Flow predictability | "A measure of how consistently teams, ARTs, and portfolios are able to meet their commitments."[5] | High and steady from one interval to the next. |
How do the flow metrics relate to each other?
They move together. When load goes up, flow time goes up and velocity eventually falls. Little's Law states the relationship: the average number of items in a system equals the average arrival rate multiplied by the average time an item spends in it.[4]
John Little's formulation is L = λW, where L is the average number of items in the system, λ the average arrival rate and W the average time in the system.[4] For a delivery team the practical reading is simple. With throughput roughly fixed, the only way to make work finish sooner is to have less of it in progress.
That is why flow load is the place to start. You cannot decide to have a shorter flow time, but you can decide to start fewer things.
How do SAFe, the Flow Framework, Kanban and DORA metrics compare?
They measure overlapping things at different levels. Kanban metrics describe any workflow. The Flow Framework and SAFe apply the same ideas to business-level work items. DORA measures the software delivery pipeline specifically.
| Concept | SAFe[5] | Flow Framework[2] | Kanban Guide[3] | DORA[7] |
|---|---|---|---|---|
| How much gets done | Flow velocity | Flow velocity | Throughput | Deployment frequency |
| How long it takes | Flow time | Flow time | Cycle time | Change lead time |
| How much is in progress | Flow load | Flow load | WIP | |
| Waiting vs working | Flow efficiency | Flow efficiency | ||
| Mix of work | Flow distribution | Flow distribution | ||
| Reliability | Flow predictability | Service level expectation | ||
| Age of unfinished work | Work item age | |||
| Stability of releases | Change fail rate, deployment rework rate, failed deployment recovery time |
- Kanban: "The four mandatory flow metrics to track in Kanban are" WIP, throughput, work item age and cycle time. The guide notes that names are flexible: "Cycle Time could be Flow Time, Throughput could be Delivery Rate."[3]
- DORA: now "five software delivery performance metrics", up from the original four keys, and its research holds that "speed and stability are not tradeoffs."[7]
- Flow predictability is SAFe's addition. It is not one of the Flow Framework's metrics.[2]
How do you calculate flow efficiency?
Flow efficiency is active time divided by total flow time, as a percentage. If a feature took 20 days from start to finish and people worked on it for 5 of them, its flow efficiency is 25%.
The two main sources word it slightly differently. SAFe uses "value-added work activities divided by the total flow time."[5] The Flow Framework uses "the ratio of active time vs. wait time."[2] Use the SAFe form, active divided by total, so the result is a percentage that can reach 100.
To measure it you need to know when work is waiting. Add explicit waiting states to your workflow, such as "ready for review" or "waiting for test environment", and the tool can do the arithmetic. Most teams that measure it for the first time are surprised by how low it is, because waiting is invisible until you look for it.
How do you improve flow?
Limit work in progress, make queues visible, reduce batch size, remove the dependency or hand-off that causes the longest wait, and review the metrics on a fixed cadence. SAFe groups its advice into eight flow accelerators.[6]
- Make the work and its states visible, including the waiting states.
- Limit work in progress at team and train level. Finish before starting.
- Find the longest queue using flow time by state, and fix that one first.
- Work in smaller batches. Smaller features flow faster and fail cheaper.
- Remove dependencies that create waits. See the dependency management guide.
- Protect capacity for non-feature work so defects and debt do not pile up. Flow distribution shows whether you are.
- Review the trend in every Inspect and Adapt.
What are the common mistakes with flow metrics?
Using them to compare or judge teams, looking at one metric alone, watching averages and ignoring variation, and setting targets that invite gaming.
- Comparing teams. Work items differ in size between teams. Compare a team with its own history.
- One metric alone. Velocity can rise while flow time gets worse, if items are simply made smaller.
- Averages only. A percentile tells you more. Kanban's service level expectation is phrased that way: "85% of work items will be finished in eight days or less."[3]
- Targets. DORA warns that setting metrics as a goal "increases the likelihood that teams will try to game the metrics."[7]
- Measuring without acting. A dashboard nobody discusses changes nothing.
The agile metrics guide covers the wider set and how to avoid misuse.
How do you get flow metrics from Jira or Azure DevOps?
Both tools hold the data, as status changes on work items, and both have basic charts. Getting all six metrics for a train, by work type and against PI commitments, usually needs a reporting layer on top.
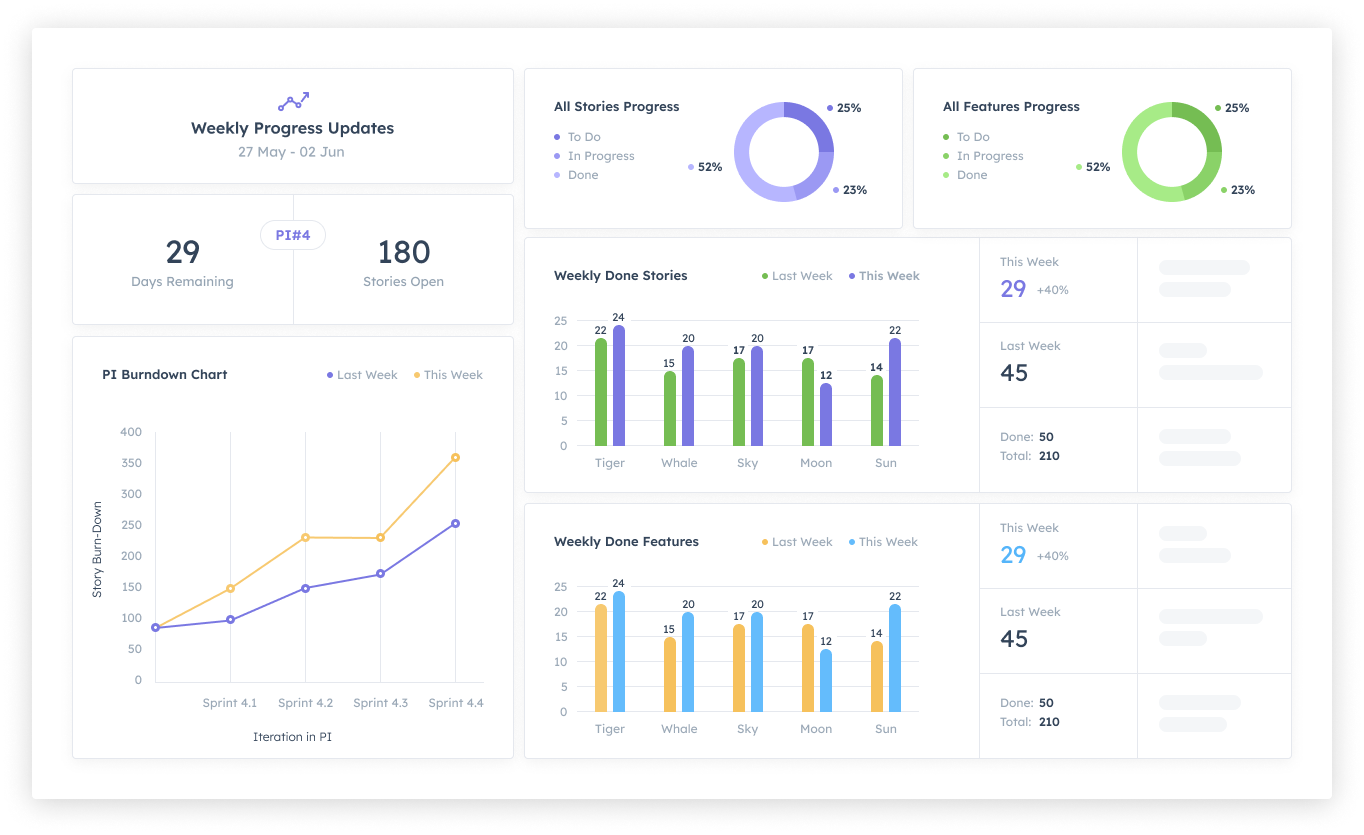
Kendis calculates flow metrics in real time from the work items on your boards: flow distribution, velocity, time and efficiency, alongside predictability from PI Objectives.
Put this into practice, free for 6 months
Kendis is a PI Planning and tracking platform that sits on top of Jira and Azure DevOps. The free trial runs for six months, long enough to plan and track two full PIs with your real backlog before anyone has to approve a budget.
- 6 months free, no credit card
- Choose EU hosting (OVHcloud, Frankfurt) or US hosting (AWS)
- Planning board, dependencies, PI objectives, ROAM risks, solution boards
- Two-way sync with Jira Cloud, Jira Data Center and Azure DevOps
- ISO/IEC 27001 certified, GDPR compliant, DORA Schedule available
- No user caps and no setup costs during the trial
One trial per organisation that has not used Kendis in the last twelve months. After the trial, Premium Cloud is $14 per user per month billed annually, or $16 monthly, and you license only the people who plan. SSO, Kendis AI and premium support are part of paid plans. See pricing and the free trial terms.
Flow metrics: frequently asked questions
What are flow metrics?
Flow metrics measure how work moves through a value stream: how much is completed, how long it takes, how much is in progress, how much time is spent waiting, what mix of work it is and how reliably commitments are met.
What are the six SAFe flow metrics?
Flow distribution, flow velocity, flow time, flow load, flow efficiency and flow predictability.
What is the difference between flow time and cycle time?
They describe the same idea: elapsed time from when work starts to when it finishes. The Kanban Guide calls it cycle time and notes it could equally be called flow time.
How is flow efficiency calculated?
Divide the time spent actively working on an item by its total flow time. An item worked on for 5 days out of a 20-day flow time has a flow efficiency of 25%.
What is flow load?
Flow load is the number of work items currently in progress, whether active or waiting. It is the same idea as work in progress, or WIP.
Are flow metrics the same as DORA metrics?
No. Flow metrics describe business-level work items moving through a value stream. DORA's five metrics describe software delivery performance, such as change lead time and deployment frequency.
Which flow metric should you improve first?
Flow load. Reducing the amount of work in progress is directly in your control, and it shortens flow time and improves predictability as a result.
Sources
Every external claim in this guide links to the primary source below. All links were checked on 12 October 2026.
- Scaled Agile, Inc.. Measure and Grow.
- Flow Framework (Planview). Discover the Flow Framework.
- Kanban Guides. The Kanban Guide (May 2025).
- John D. C. Little (Project Production Institute reprint). Little's Law as Viewed on Its 50th Anniversary.
- Scaled Agile, Inc.. SAFe Glossary.
- Scaled Agile, Inc.. Principle 6: Make value flow without interruptions.
- DORA. DORA's software delivery performance metrics (updated 5 January 2026).
How this guide is maintained: definitions are checked against the framework pages and other primary sources listed above, and the guide is updated when terminology or guidance changes. Examples, checklists and practical advice are Kendis guidance and are not official SAFe material. SAFe and Scaled Agile Framework are registered trademarks of Scaled Agile, Inc.