Agile metrics in 60 seconds
- Measure three things: outcomes, flow and competency, in SAFe's terms.[1]
- At scale, the headline number is predictability: value delivered against value planned.
- Velocity is a planning aid: "there is no meaningful comparison of velocity 'between' different teams."[2]
- Delivery performance: DORA now tracks five metrics, and finds speed and stability are not trade-offs.[3]
- The rule: use metrics to improve the system, never to rank people.
What are agile metrics?
Agile metrics are measures that help teams and leaders see how well value is being delivered and where to improve. The useful ones describe outcomes and the flow of work. The harmful ones are activity counts used to judge people.
Software delivery is hard to measure, and it is worth being honest about that. Martin Fowler argued two decades ago that productivity cannot be measured directly because output cannot be.[4] What you can measure is whether the system is healthy: how long things take, how often commitments hold, how many defects escape and whether customers behave differently as a result.
What should you measure?
Measure in three areas. Outcomes: are customers and the business better off? Flow: is work moving quickly and smoothly? Predictability: are teams delivering what they committed to? SAFe groups measurement into outcomes, flow and competency.[1]
SAFe frames the outcomes question as "Do our solutions meet the needs of our customers and the business?", measured with "KPIs, OKRs, and employee engagement metrics."[1]
Which metrics are useful at team level?
At team level, use cycle time, throughput, work in progress and work item age to manage flow, and velocity and a burndown or burnup to plan and track an iteration.
| Metric | Definition | Use it to |
|---|---|---|
| Velocity | "The team adds up effort estimates associated with user stories that were completed during that iteration. This total is called velocity."[2] | Forecast how much the same team can take into the next iteration. |
| Burndown chart | A graph "relating the quantity of work remaining... and the time elapsed since the start."[5] | See whether the iteration is on track. |
| Burnup chart | Shows completed work with a separate line for total scope.[5] | See scope change, which a burndown hides. |
| Cycle time | "The elapsed time between when a work item started and when a work item finished."[6] | Find out how long work really takes. |
| Throughput | "The number of work items finished per unit of time."[6] | Forecast without estimates. |
| WIP | "The number of work items started but not finished."[6] | Spot overload early. |
| Work item age | "The elapsed time between when a work item started and the current date."[6] | Catch stuck work before it is late. |
| Cumulative flow diagram | Visualises "the flow of work through your system."[7] | See where queues are building. |
Lead time and cycle time are often confused. Agile Alliance describes lead time as "the time elapsed between the identification of a requirement and its fulfillment", a measurement from the user's point of view, while cycle time is from the developer's.[8]
Which metrics matter for an Agile Release Train?
For a train, track predictability first, then the six flow metrics, dependencies resolved on time, and how much the scope changed after PI Planning.
| Metric | What it tells you |
|---|---|
| ART predictability | Business value achieved against business value planned. In SAFe, "an average of the achievement score for each teams on the ART for the PI."[9] |
| Flow metrics | Distribution, velocity, time, load, efficiency and predictability.[1] See the flow metrics guide. |
| Scope change | Features and stories added, removed or moved since the planning baseline. |
| Dependencies resolved on time | How reliable commitments between teams are. See the dependency guide. |
| PI Objectives achieved | Committed objectives met, and how many uncommitted ones were also delivered. |
| Risks | How many ROAMed risks materialised. See the ROAM guide. |
Which delivery and quality metrics should you track?
Use DORA's five software delivery metrics for the pipeline and an escaped defect measure for quality. DORA groups its metrics into throughput and instability, and its research finds that "speed and stability are not tradeoffs."[3]
| Metric | Definition[3] |
|---|---|
| Change lead time | "The amount of time it takes for a change to go from committed to version control to deployed in production." |
| Deployment frequency | "The number of deployments over a given period or the time between deployments." |
| Failed deployment recovery time | "The time it takes to recover from a deployment that fails and requires immediate intervention." |
| Change fail rate | "The ratio of deployments that require immediate intervention following a deployment." |
| Deployment rework rate | "The ratio of deployments that are unplanned but happen as a result of an incident in production." |
For quality, a bug escape rate is "the percentage or ratio of defects that were missed by the team(s) and subsequently discovered by end-users or customers in a production environment."[10] Ten escaped defects against a hundred found before release is 10 out of 110, or about 9%.
How do you measure outcomes, not output?
Tie the work to a measurable change you expect to see: more customers using a feature, fewer support calls, a faster process. Then check whether it happened. OKRs are a common way to state the expected change.
- OKRs. SAFe defines them as "a collaborative framework for establishing clear goals and measurable outcomes."[9]
- Customer measures. Satisfaction, adoption, retention, task completion.
- Business measures. Revenue, cost to serve, time to market.
- Business value on PI Objectives. Scored by Business Owners at planning and again at the end.
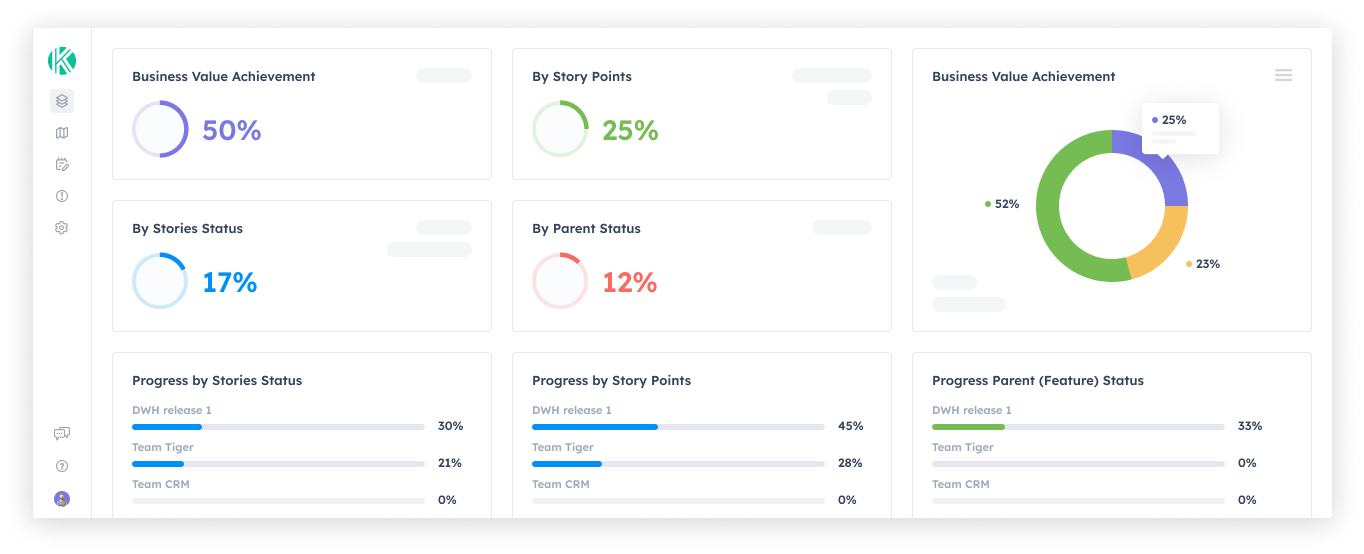
Output metrics answer "did we build it?". Outcome metrics answer "did it work?". A train can score 100% on the first and learn nothing about the second. In Kendis, OKRs link to PI Objectives and features so the two can be read together.
How are agile metrics misused?
By turning them into targets, comparing teams, and treating velocity or story points as productivity. Each of these changes behaviour in ways that make the number look better and the delivery worse.
- Comparing velocity between teams. Agile Alliance lists this as a pitfall[2], and Atlassian's advice is to "resist the temptation to compare velocity across teams."[11]
- "Setting the velocity". Phrases like that "reveal a basic misunderstanding."[2] Velocity is observed, not assigned.
- Story points as performance. Ron Jeffries, who is credited with the idea, wrote: "I think comparing teams on quality of estimates or velocity is harmful."[12]
- Targets. Goodhart's law is usually summarised as "when a measure becomes a target, it ceases to be a good measure."[13] DORA says the same of its own metrics: set them as a goal and teams "will try to game the metrics."[3]
- League tables. "The goal is to improve your team's performance over time, not to compete against other teams."[3]
- Too many metrics. If nobody can say what decision a metric informs, drop it.
What is a sensible starter set of agile metrics?
Start with five or six: predictability, flow time, flow load, scope change, escaped defects and one outcome measure. Review them together on a fixed cadence and add more only when you have a question they cannot answer.
- Predictability per train, per planning interval.
- Flow time for features, as a percentile and not only an average.
- Flow load, to see whether too much is in progress.
- Scope change since planning.
- Escaped defects, or change fail rate if you deploy often.
- One outcome measure per objective or OKR.
Look at the trend, not the snapshot. Discuss the metrics with the teams they describe, in the Inspect and Adapt event, and agree one improvement at a time.
Put this into practice, free for 6 months
Kendis is a PI Planning and tracking platform that sits on top of Jira and Azure DevOps. The free trial runs for six months, long enough to plan and track two full PIs with your real backlog before anyone has to approve a budget.
- 6 months free, no credit card
- Choose EU hosting (OVHcloud, Frankfurt) or US hosting (AWS)
- Planning board, dependencies, PI objectives, ROAM risks, solution boards
- Two-way sync with Jira Cloud, Jira Data Center and Azure DevOps
- ISO/IEC 27001 certified, GDPR compliant, DORA Schedule available
- No user caps and no setup costs during the trial
One trial per organisation that has not used Kendis in the last twelve months. After the trial, Premium Cloud is $14 per user per month billed annually, or $16 monthly, and you license only the people who plan. SSO, Kendis AI and premium support are part of paid plans. See pricing and the free trial terms.
Agile metrics: frequently asked questions
What are agile metrics?
Agile metrics are measures that show how well value is being delivered and where to improve. The useful ones cover outcomes, the flow of work, predictability and quality.
What are the most important agile metrics?
At scale: predictability, flow time, flow load, scope change, escaped defects and at least one outcome measure such as customer satisfaction or OKR progress.
What is velocity in agile?
Velocity is the total of the effort estimates for the user stories a team completed in an iteration. It is used by that team to forecast future iterations, and is not comparable between teams.
What is the difference between lead time and cycle time?
Lead time runs from when a requirement is identified to when it is fulfilled, the customer's view. Cycle time runs from when work starts to when it finishes, the team's view.
What are the DORA metrics?
DORA currently tracks five software delivery performance metrics: change lead time, deployment frequency, failed deployment recovery time, change fail rate and deployment rework rate.
Why should you not compare velocity between teams?
Because story points are relative to each team. Agile Alliance states there is no meaningful comparison of velocity between different teams, and comparing them encourages inflated estimates.
How do you measure predictability in SAFe?
With the ART Predictability Measure: the business value each team achieved against the business value it planned, averaged across the teams on the train for the PI.
Sources
Every external claim in this guide links to the primary source below. All links were checked on 12 October 2026.
- Scaled Agile, Inc.. Measure and Grow.
- Agile Alliance. Glossary: Velocity.
- DORA. DORA's software delivery performance metrics (updated 5 January 2026).
- Martin Fowler. Cannot Measure Productivity (29 August 2003).
- Agile Alliance. Glossary: Burndown chart.
- Kanban Guides. The Kanban Guide (May 2025).
- Microsoft Learn. Cumulative flow guidance (Azure DevOps).
- Agile Alliance. Glossary: Lead time.
- Scaled Agile, Inc.. SAFe Glossary.
- Ministry of Testing. Glossary: Bug escape rate.
- Atlassian. Five agile metrics you won't hate.
- Ron Jeffries. Story Points Revisited (23 May 2019).
- Wikipedia. Goodhart's law.
How this guide is maintained: definitions are checked against the framework pages and other primary sources listed above, and the guide is updated when terminology or guidance changes. Examples, checklists and practical advice are Kendis guidance and are not official SAFe material. SAFe and Scaled Agile Framework are registered trademarks of Scaled Agile, Inc.