Agile Gantt charts in 60 seconds
- Definition: a Gantt chart is a bar chart that shows a project schedule; modern versions also show dependencies between activities and current status.[1]
- The tension: a Gantt chart treats the plan as the thing to follow, while the Agile Manifesto values "responding to change over following a plan".[2]
- When it helps in agile: fixed external dates, hardware or supplier lead times, and showing cross-team dependencies to stakeholders.
- What to use instead: a roadmap for direction, a program board for the current increment, and a Kanban board for flow.
- In SAFe: a PI roadmap usually covers three PIs; the first is committed and the next two are a forecast.[3]
1. What is a Gantt chart?
A Gantt chart is a bar chart that illustrates a project schedule. Each task is a horizontal bar placed on a calendar, so its position shows when the task starts and its length shows how long it takes. Modern Gantt charts also show the dependencies between tasks and how far each one has progressed.[1]
A typical Gantt chart has six elements:
- Task list down the left side, often grouped into phases.
- Time axis across the top, in days, weeks or months.
- Bars for each task, from start date to end date.
- Dependencies, drawn as arrows from one bar to the next.
- Milestones, shown as diamonds on a single date.
- Progress, shown as a shaded part of each bar, and a "today" line.
Where the Gantt chart comes from
The chart is named after Henry Gantt, an American engineer who designed and popularised it around 1910 to 1915. The first known chart of this type was made earlier, in 1896, by the Polish engineer Karol Adamiecki, who called it a harmonogram.[1] For decades Gantt charts were drawn by hand, and every change to a project meant redrawing the chart, which limited how useful they were when plans kept changing.[4]
2. Do Gantt charts work in agile?
Partly. A Gantt chart works in agile at the level of features, increments and milestones, where it shows sequence and dependencies across teams. It works badly at the level of tasks, because agile teams decide their own tasks each iteration and a detailed task schedule goes out of date within days.
The friction comes from what each approach treats as fixed. A traditional Gantt chart fixes scope and derives dates from it. Agile fixes time and lets scope move: in Scrum, Sprints "are fixed length events of one month or less",[5] and the team decides how much of the backlog fits in each one. The Agile Manifesto states the preference directly: responding to change over following a plan.[2]
That does not make timelines useless. Large organisations still need to answer "when will this be ready?", coordinate with suppliers, and meet dates they do not control. The question is not Gantt or agile, but which level of detail to put on a timeline and who owns it.
When a Gantt-style view helps
- A date is fixed from outside: a regulation, a contract, a launch event.
- Work depends on hardware, suppliers or other long lead times.
- Several teams or trains must deliver in sequence and need to see the critical path.
- Executives or customers need a visual of what lands when.
When it hurts
- It is built at task level and maintained by someone outside the team.
- Dates are shown with false precision months ahead.
- Slipping bars are redrawn instead of the plan being re-thought.
- It replaces conversation between teams instead of supporting it.
3. What is an agile Gantt chart?
An agile Gantt chart is a timeline that uses iterations instead of calendar days and features or epics instead of tasks. Each bar spans the iterations in which a team expects to deliver a feature, dependencies link features across teams, and fixed dates appear as milestones. It shows the plan for an increment without prescribing how teams do the work.
Compared with a classic Gantt chart, an agile one changes four things:
| Classic Gantt chart | Agile Gantt chart | |
|---|---|---|
| Rows | Tasks and activities | Features, epics or capabilities |
| Columns | Calendar days or weeks | Iterations or sprints, grouped into increments |
| Who updates it | A project manager | The teams, through their backlog tool |
| How far ahead | The whole project | One increment in detail, later ones as a forecast |
In Jira, the timeline view is effectively this: Atlassian describes it as visualising "data from your work items in a Gantt chart", with parent items such as epics and their children nested underneath. A timeline shows one space only; planning across several spaces needs a plan in Jira Premium or Enterprise.[6] In Azure Boards, Delivery Plans show teams' scheduled work items by sprint in a calendar view, for up to 20 team backlogs.[7]
4. Gantt chart vs roadmap vs Kanban board vs program board
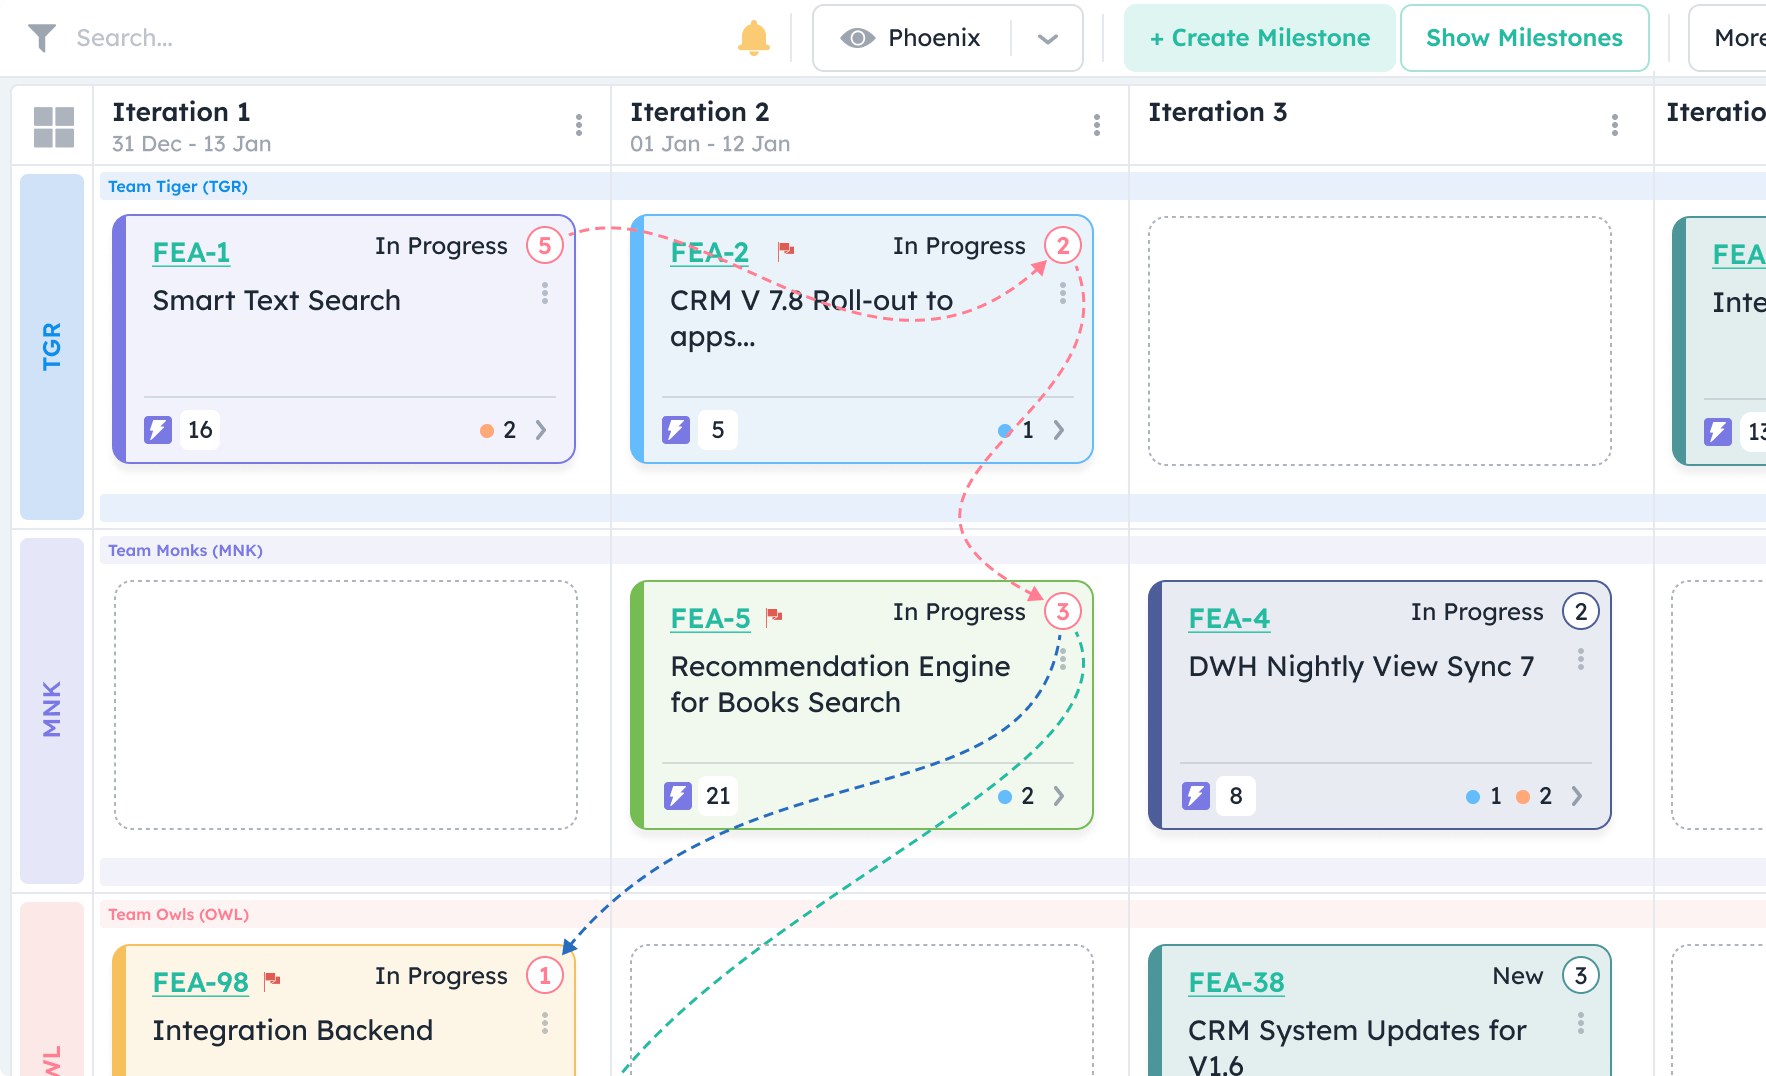
A Gantt chart schedules tasks on a calendar. A roadmap shows features and milestones over a longer horizon. A Kanban board shows work flowing through states with no time axis. A PI program board shows which team delivers which feature in which iteration of the current increment, and how those features depend on each other.
| Gantt chart | Roadmap | Kanban board | Program board | |
|---|---|---|---|---|
| Unit of work | Tasks and activities | Features, epics, capabilities, milestones | Stories, features or any work item | Features and dependencies |
| Time axis | Calendar days or weeks | Months, quarters or PIs | None: work flows through states | Iterations within one PI |
| Commitment | Dates are the plan | Near term committed, later horizons forecast | Pull when capacity allows | Committed for the current PI |
| Changes | Re-baselined when the plan slips | Revised each PI or quarter | Continuous | Replanned at the next PI Planning |
| Best for | Fixed-scope work with hard sequencing | Communicating direction to stakeholders | Managing flow and spotting blockers | Coordinating many teams for one increment |
Gantt chart vs Kanban
The two answer different questions. A Gantt chart answers "when?", by placing work on a calendar. A Kanban board answers "what is happening now, and what is stuck?", by showing work moving through states and limiting how much is in progress. Kanban University describes Kanban as "a method for continuous change", applied on top of an existing way of working.[8] Teams that use Kanban day to day can still use a roadmap or timeline to communicate dates outwards.
Gantt chart vs roadmap
A roadmap sits a level above a Gantt chart. SAFe defines a roadmap as "a schedule of events and milestones that forecasts and communicates planned solution deliverables over a time horizon".[9] The key word is forecasts: a roadmap says what you expect to deliver, and is revised as you learn, while a Gantt chart is usually treated as the plan to execute.
5. Gantt charts and roadmaps in SAFe
SAFe does not use Gantt charts. It uses roadmaps at three levels: PI roadmaps for an Agile Release Train or Solution Train, product and solution roadmaps for a longer view of milestones and deliverables, and portfolio roadmaps for a multiyear view across value streams.[3]
The PI roadmap is the closest thing to an agile Gantt chart. It typically covers three PIs: the first represents committed work, and the next two are a forecast.[3] Within the current PI, the program board (ART Planning Board) shows features by team and iteration, with dependencies and milestones, and is built by the teams during PI Planning.[10]
Two SAFe ideas explain why a single detailed schedule does not fit. Milestones are "a specific goal, event, or point in time used to evaluate progress toward a larger objective",[9] so they are checkpoints rather than a sequence of tasks. And SAFe separates development cadence from release timing: releases are "decoupled from the work to deploy the functionality", so the business decides when to release value.[11]
6. How to build an agile release plan or PI roadmap
Start from outcomes and fixed dates, size features rather than tasks, lay features onto iterations using real team capacity, draw cross-team dependencies, mark the current increment as committed and later ones as a forecast, and revisit the plan at every increment.
- Start from outcomes, not tasks. Write down the two or three outcomes the release or increment must achieve, and the milestones that are genuinely fixed: a regulatory date, a trade show, a contract.
- Size features, not activities. Break the outcomes into features and estimate them relatively. Leave task breakdown to the teams.
- Lay features onto iterations. Place each feature in the iteration where a team plans to finish it, using real team capacity.
- Draw the dependencies. Link every feature that needs work from another team or supplier, with an owner and a need-by iteration.
- Mark committed versus forecast. Treat the current increment as committed and everything later as a forecast, as SAFe does for PI roadmaps.
- Add milestones on the same axis. Show fixed dates as milestones so everyone can see which features they depend on.
- Review it every increment. Re-plan at each PI Planning or quarterly planning event, and update the forecast horizons with what you learned.
Keep the plan at feature level. If a stakeholder asks for task dates, give them the feature and the iteration it is planned for; the team's sprint board holds the detail.
7. Agile timelines and timeline views
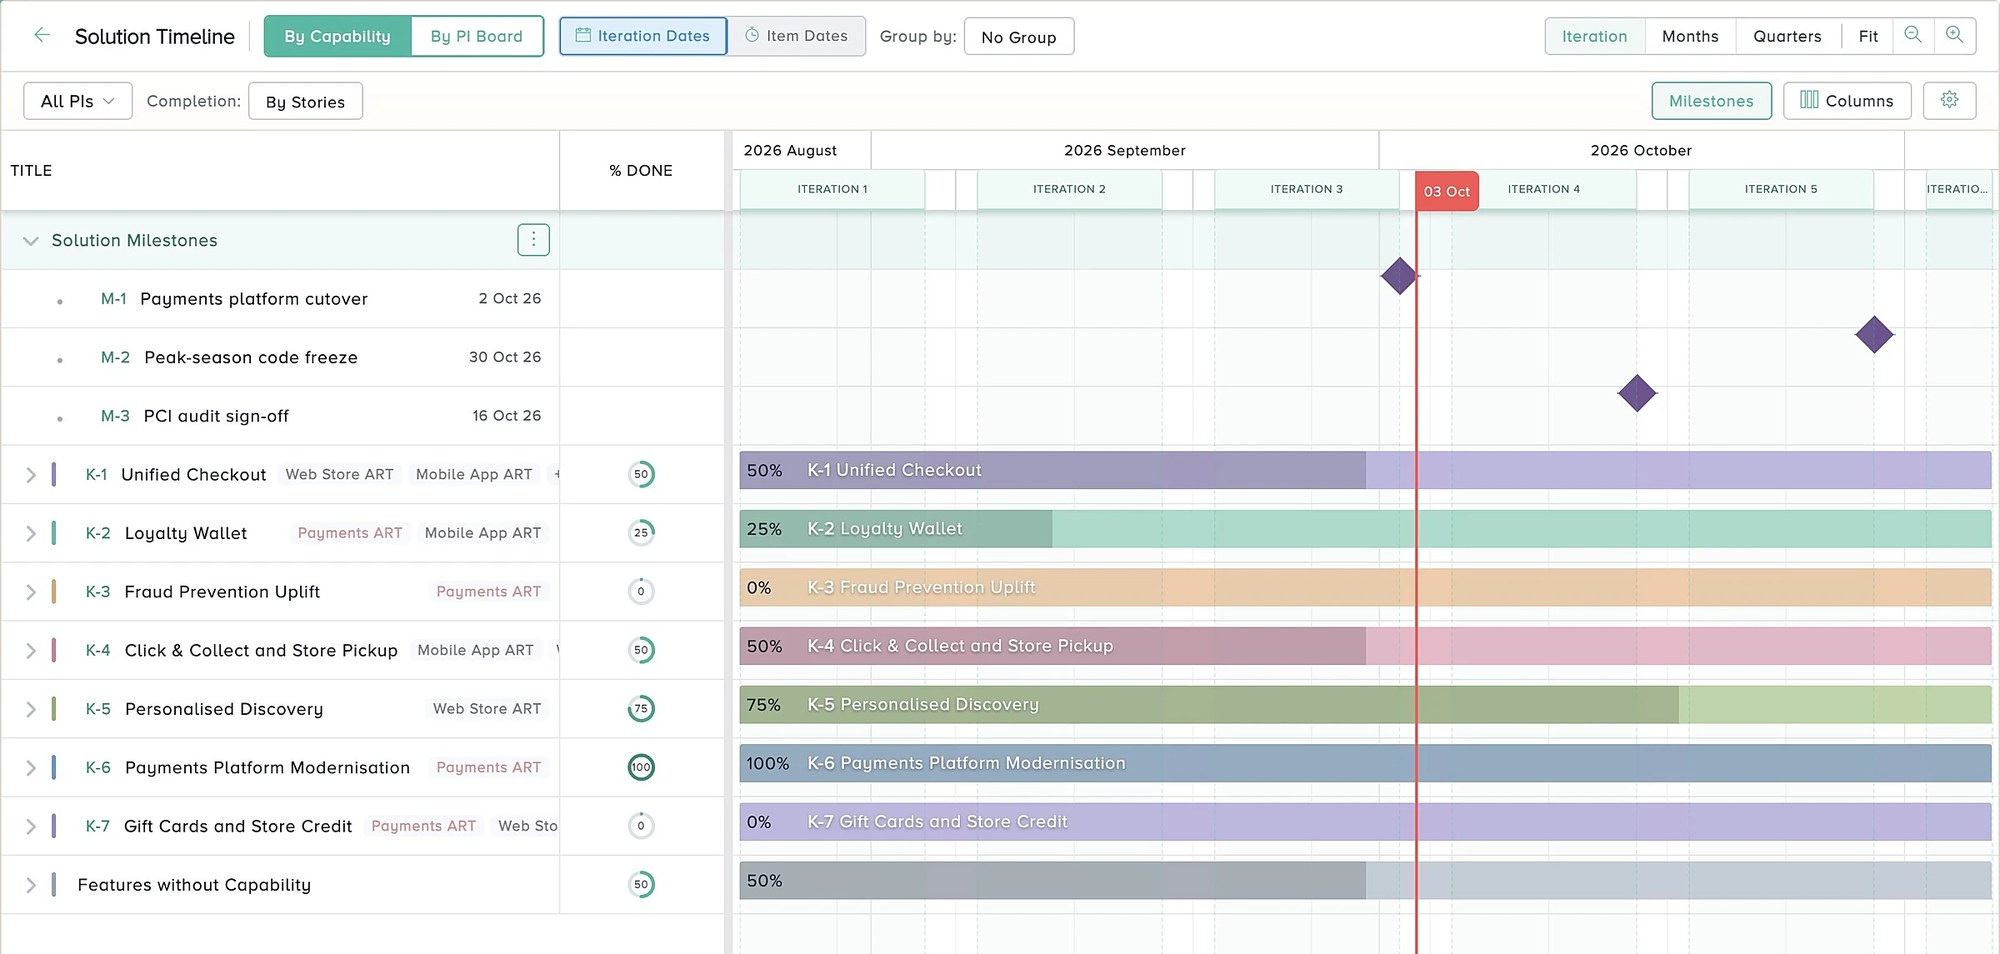
An agile timeline is a timeline view built from the backlog: features and epics as bars across iterations, milestones on the same axis, and progress that updates as teams finish stories. To create one, choose the horizon (one increment, or a few), group items by team, train or epic, add fixed dates as milestones, and link dependencies.
A timeline view differs from a hand-drawn project timeline in one way that matters: it is generated from the same work items the teams update every day, so it does not go stale. That is how Jira describes its timeline, a view that visualises "data from your work items in a Gantt chart".[6]
How to create an agile project timeline
- Pick the horizon. One PI or quarter in detail; anything later as a forecast.
- Choose the rows. Epics or features, grouped by team, train or capability. Not tasks.
- Use iterations as columns. Sprints or iterations make the plan match how teams commit.
- Add milestones. Fixed external dates, PI boundaries, releases and demos.
- Link dependencies. Draw every cross-team dependency, with an owner and a need-by iteration.
- Let progress roll up. Bar progress should come from story status, not manual updates.
For the longer-range view above the timeline, see the agile roadmap guide.
8. Tools: Gantt and timeline views for agile teams
Jira offers a timeline view inside a space and cross-space plans in Premium and Enterprise. Azure DevOps offers Delivery Plans across up to 20 team backlogs. For SAFe programs, a dedicated planning layer such as Kendis adds program boards, solution timelines, dependencies and milestones across many teams, synced both ways with Jira and Azure DevOps.
| Tool | View | Scope | Notes |
|---|---|---|---|
| Jira Cloud | Timeline | One space | Gantt-style view of work items and epics; cross-space planning needs Jira Premium or Enterprise.[6] |
| Azure Boards | Delivery Plans | Up to 20 team backlogs | Calendar view by sprint, with drag-and-drop dates and dependency lines.[7][12] |
| Kendis | Program board, solution board and timeline | Many teams and trains | Features by team and iteration, cross-team dependencies, milestones and capability progress, synced both ways with Jira and Azure DevOps. |
Kendis keeps the plan at the level a train needs: features on the program board, capabilities across trains on the solution board, and dates and milestones on a timeline. Teams keep working in Jira or Azure DevOps, and the timeline updates as they do.
9. Common mistakes with timelines in agile
- Scheduling tasks months ahead. Plan features for the current increment and forecast beyond it.
- Showing forecasts as commitments. Mark committed and forecast work differently, as SAFe does for PI roadmaps.[3]
- Keeping the timeline outside the backlog tool. A chart in a slide or spreadsheet goes stale. Generate it from Jira or Azure DevOps data.
- Hiding dependencies. If two teams depend on each other, draw it, give it an owner and a need-by date. See the dependency management guide.
- Redrawing instead of replanning. When bars slip, discuss scope and priority, not only new dates.
Put this into practice, free for 6 months
Kendis is a PI Planning and tracking platform that sits on top of Jira and Azure DevOps. The free trial runs for six months, long enough to plan and track two full PIs with your real backlog before anyone has to approve a budget.
- 6 months free, no credit card
- Choose EU hosting (OVHcloud, Frankfurt) or US hosting (AWS)
- Planning board, dependencies, PI objectives, ROAM risks, solution boards
- Two-way sync with Jira Cloud, Jira Data Center and Azure DevOps
- ISO/IEC 27001 certified, GDPR compliant, DORA Schedule available
- No user caps and no setup costs during the trial
One trial per organisation that has not used Kendis in the last twelve months. After the trial, Premium Cloud is $14 per user per month billed annually, or $16 monthly, and you license only the people who plan. SSO, Kendis AI and premium support are part of paid plans. See pricing and the free trial terms.
Agile Gantt charts: frequently asked questions
What is a Gantt chart?
A Gantt chart is a bar chart that shows a project schedule. Each task is a bar on a calendar, from its start date to its end date, and modern Gantt charts also show dependencies between tasks and progress on each one.
Who invented the Gantt chart?
It is named after Henry Gantt, who designed and popularised it around 1910 to 1915. An earlier version, the harmonogram, was created in 1896 by Karol Adamiecki.
Can you use a Gantt chart in agile?
Yes, at the level of features, increments and milestones. Use iterations instead of days and features instead of tasks, and leave task planning to the teams.
What is an agile Gantt chart?
An agile Gantt chart is a timeline that uses iterations and features instead of days and tasks. Bars span the iterations in which a team plans to deliver a feature, dependencies link features across teams, and fixed dates appear as milestones.
What is the difference between a Gantt chart and a roadmap?
A Gantt chart schedules tasks on a calendar and is usually treated as the plan to execute. A roadmap shows features and milestones over a longer horizon and is a forecast that is revised as the team learns.
What is the difference between a Gantt chart and Kanban?
A Gantt chart shows when work will happen on a calendar. A Kanban board shows work moving through states and what is blocked, with no time axis. Many teams use Kanban for daily work and a roadmap or timeline to communicate dates.
Does SAFe use Gantt charts?
No. SAFe uses roadmaps: PI roadmaps, product and solution roadmaps, and portfolio roadmaps. A PI roadmap typically covers three PIs, with the first committed and the next two forecast.
What is an agile timeline?
An agile timeline is a timeline view built from the backlog, with features or epics as bars across iterations, milestones on the same axis and progress that rolls up from story status.
Does Jira have a Gantt chart?
Yes. The Jira timeline view shows work items and epics in a Gantt chart within one space. Planning across several spaces needs a plan in Jira Premium or Enterprise.
Sources
Every external claim in this guide links to the primary source below. All links were checked on 14 October 2026.
- Wikipedia. Gantt chart.
- Agile Alliance signatories. Manifesto for Agile Software Development (2001).
- Scaled Agile, Inc. Roadmap (last updated 25 February 2025).
- Gantt.com. What is a Gantt chart? Information and history.
- Ken Schwaber and Jeff Sutherland. The Scrum Guide (November 2020).
- Atlassian Support. What does the space timeline show?.
- Microsoft Learn. Use team delivery plans (Azure Boards).
- Kanban University. The Official Guide to The Kanban Method.
- Scaled Agile, Inc. SAFe Glossary.
- Scaled Agile, Inc. PI Planning.
- Scaled Agile, Inc. Release on Demand.
- Microsoft Learn. Track dependencies in Delivery Plans.
How this guide is maintained: definitions are checked against the framework pages and other primary sources listed above, and the guide is updated when terminology or guidance changes. Examples, checklists and practical advice are Kendis guidance and are not official SAFe material. SAFe and Scaled Agile Framework are registered trademarks of Scaled Agile, Inc.