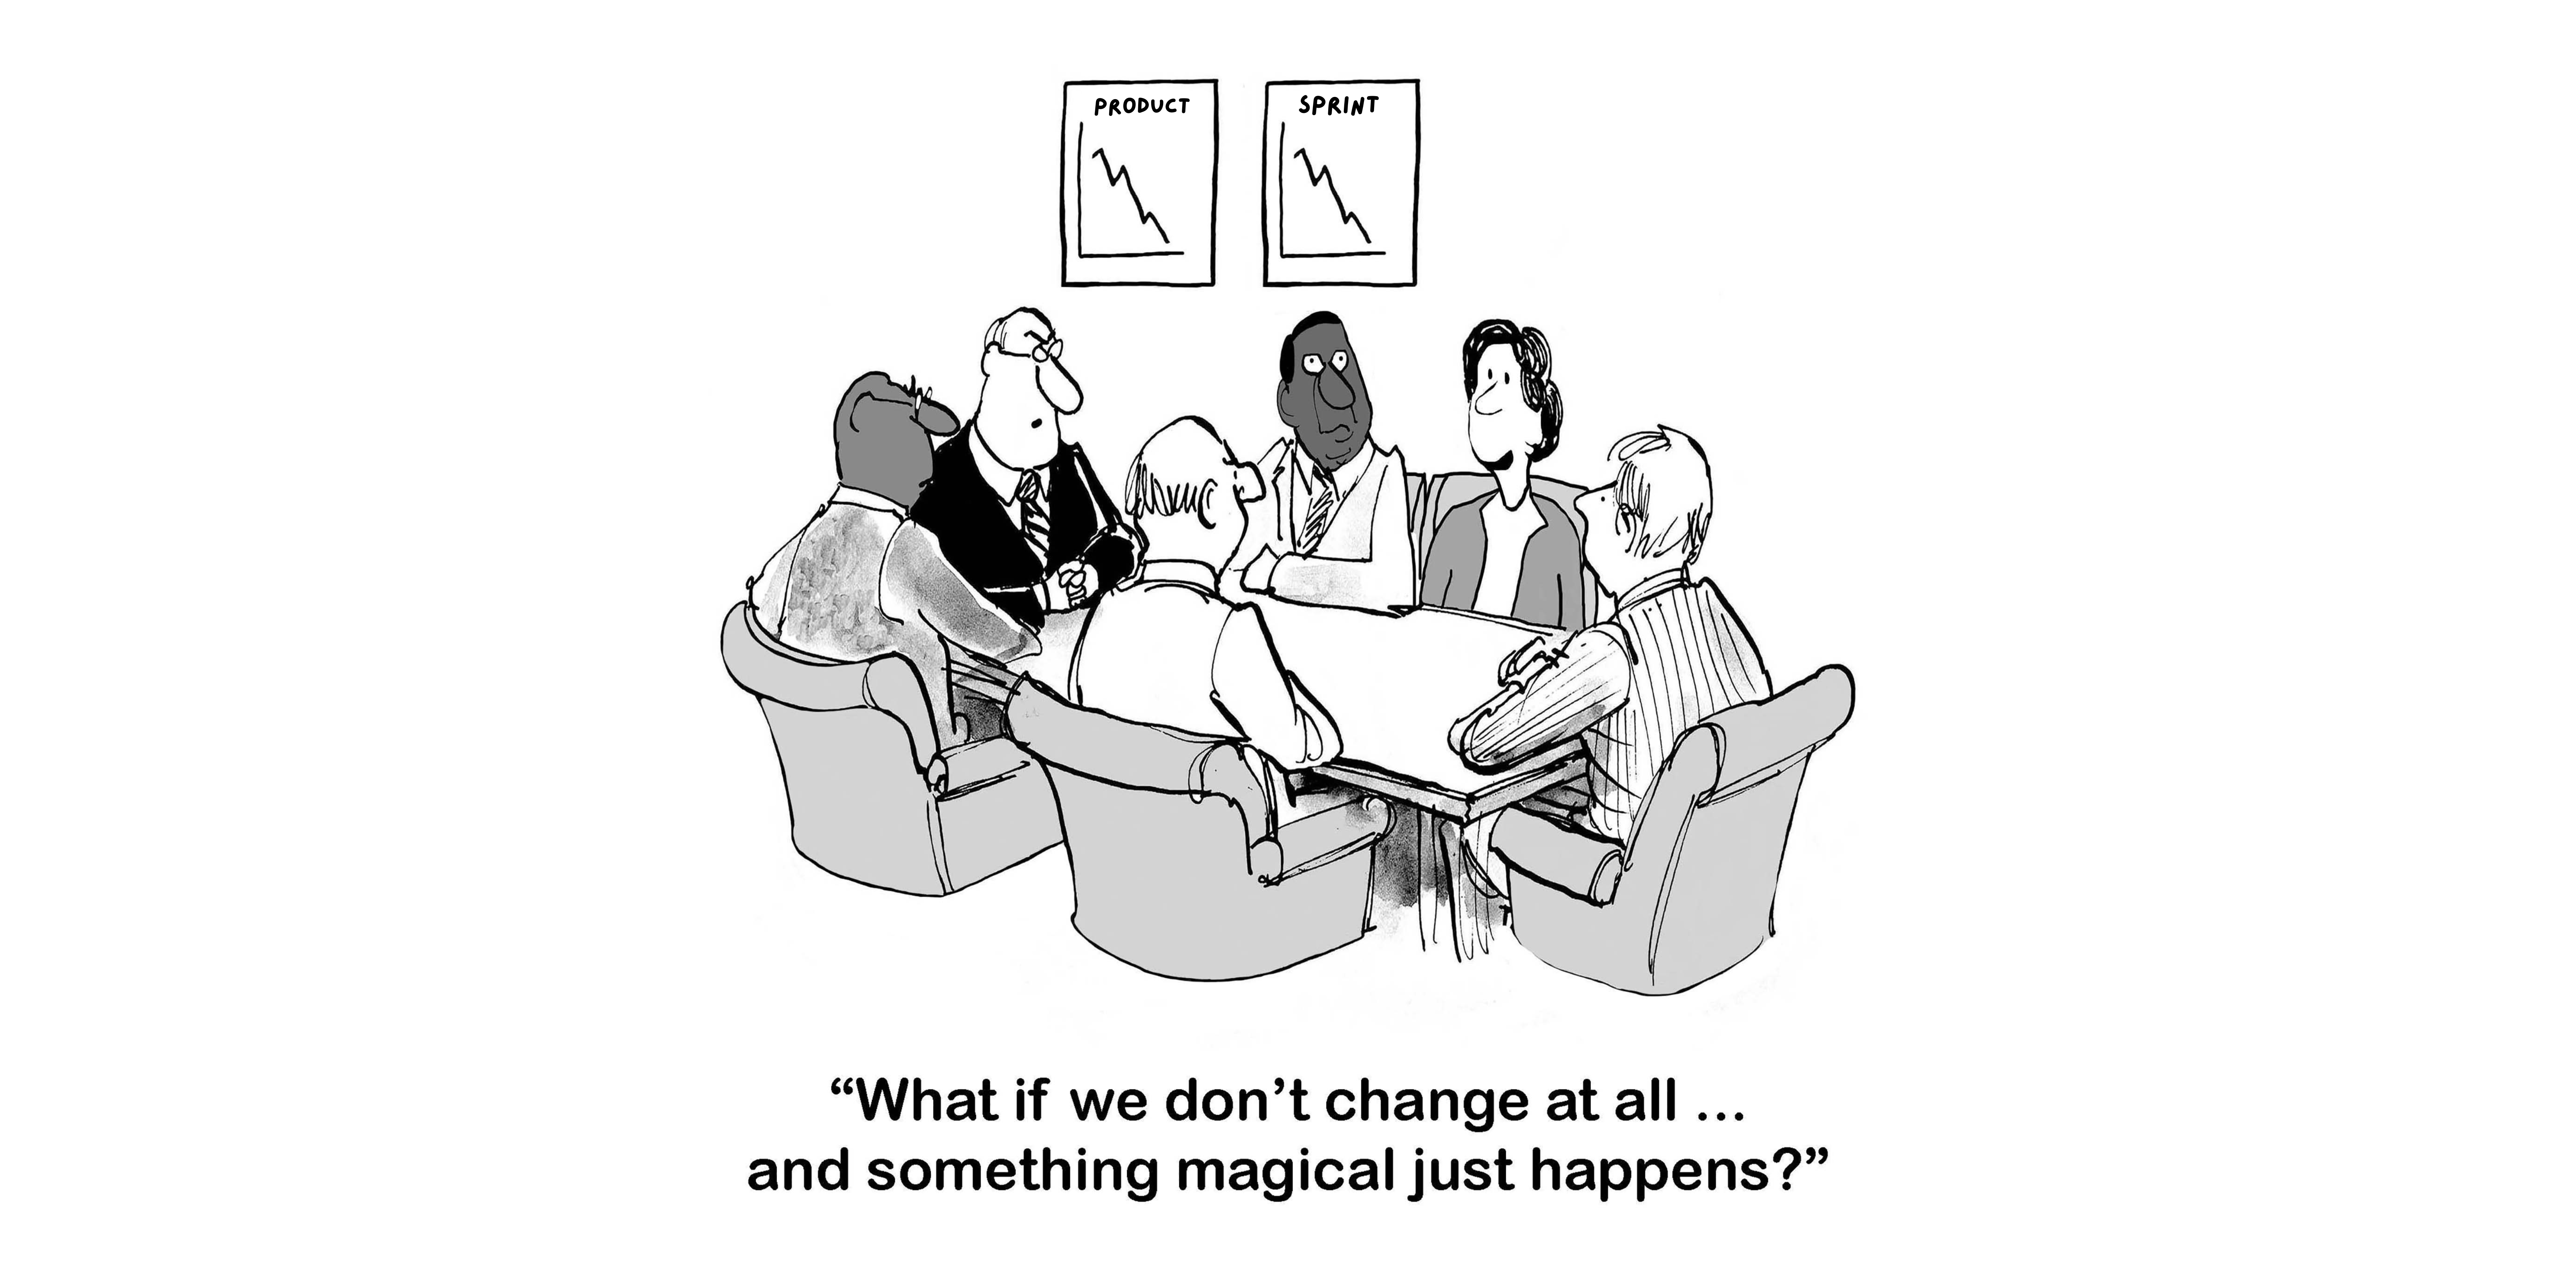
In Kendis, Sprint Tracking (or iteration tracking) is much more than just tracking story points and producing burndown and burnup charts. At Kendis, we provide a range of features that will expand your sprint tracking capabilities, all while staying integrated with your ALM tool. Let’s dive in to these features that make up our sprint tracking arsenal, which start with Analytics, SoS, and Reports and the features that are included.
Analytics
In Kendis, we of course have the burndown and burnup charts, and we provide a planned versus delivery feature as well. You will find those in the Smart reports as well as the Analytics.
Rather than looking just at charts on team level, you can view them as a program. This gives you an idea of how much is left to accomplish in the PI or increment. We also provide the different planning points i.e. from when the initial planning was made in the Big room planning versus the start of the Sprint or iteration. Stories are likely to change so we want to track all those variables. Getting a snapshot of what happened during the Sprint no longer has to be a challenge. Let’s breakdown some of what is included in Analytics, including the Team Progress Tab, Feature Delivery, and User Stories Delivery.
Team Progress Tab
This is found under delivery by teams tab which you can see under analytics.
You have all of the teams on your board on the left hand-side and currently, 7 columns. Going from left to right, we see the count of the Stories completion and the Story Point completion, as well as the two percentages. Viewing your team progress has never been this accessible.
Feature Delivery
Moving into Feature Delivery, first you have the features that were planned to be delivered in the Sprint. Kendis will give you the number of Features or Epics that were planned and then the number actually delivered. And with all of these, you can click on the number and get the specific information. You can either click on the ones that are done, or the number that shows all. Within the numbers that show all, will also be the “Done” ones.
You can even filter, if you have Features or epics by teams, and see that view or you can search for particular features. If you need to export these, then you can export into excel.
If you hover over the number, it will explain what the numbers represent. You see the percentage done overall of all your features or epics.
User Stories Delivery
We can see Planned versus Delivery again but this time on the User stories. We will give a percentage of what was completed in the Sprint by their status as well as the completion by Story points.
You will also see the teams that delivered above 80% and those that may need additional support by delivering under 50% of what they had planned in their Sprints. You can hover over and get the team names. There will be an enhancement to provide that data in a different way and maybe export it depending how it is being used. In this example, you see the 3 teams on my board that did not deliver over.
The Spill Overs will show you exactly the number of Stories that moved into the upcoming Sprints. Whether they were just not done or moved out into the next Sprint. We will show you the percentage from all your teams combined. As well as the ability to filter on the teams.
We will also see Scope Changes. These are when new stories have been created during the execution.
Scrum of Scrums
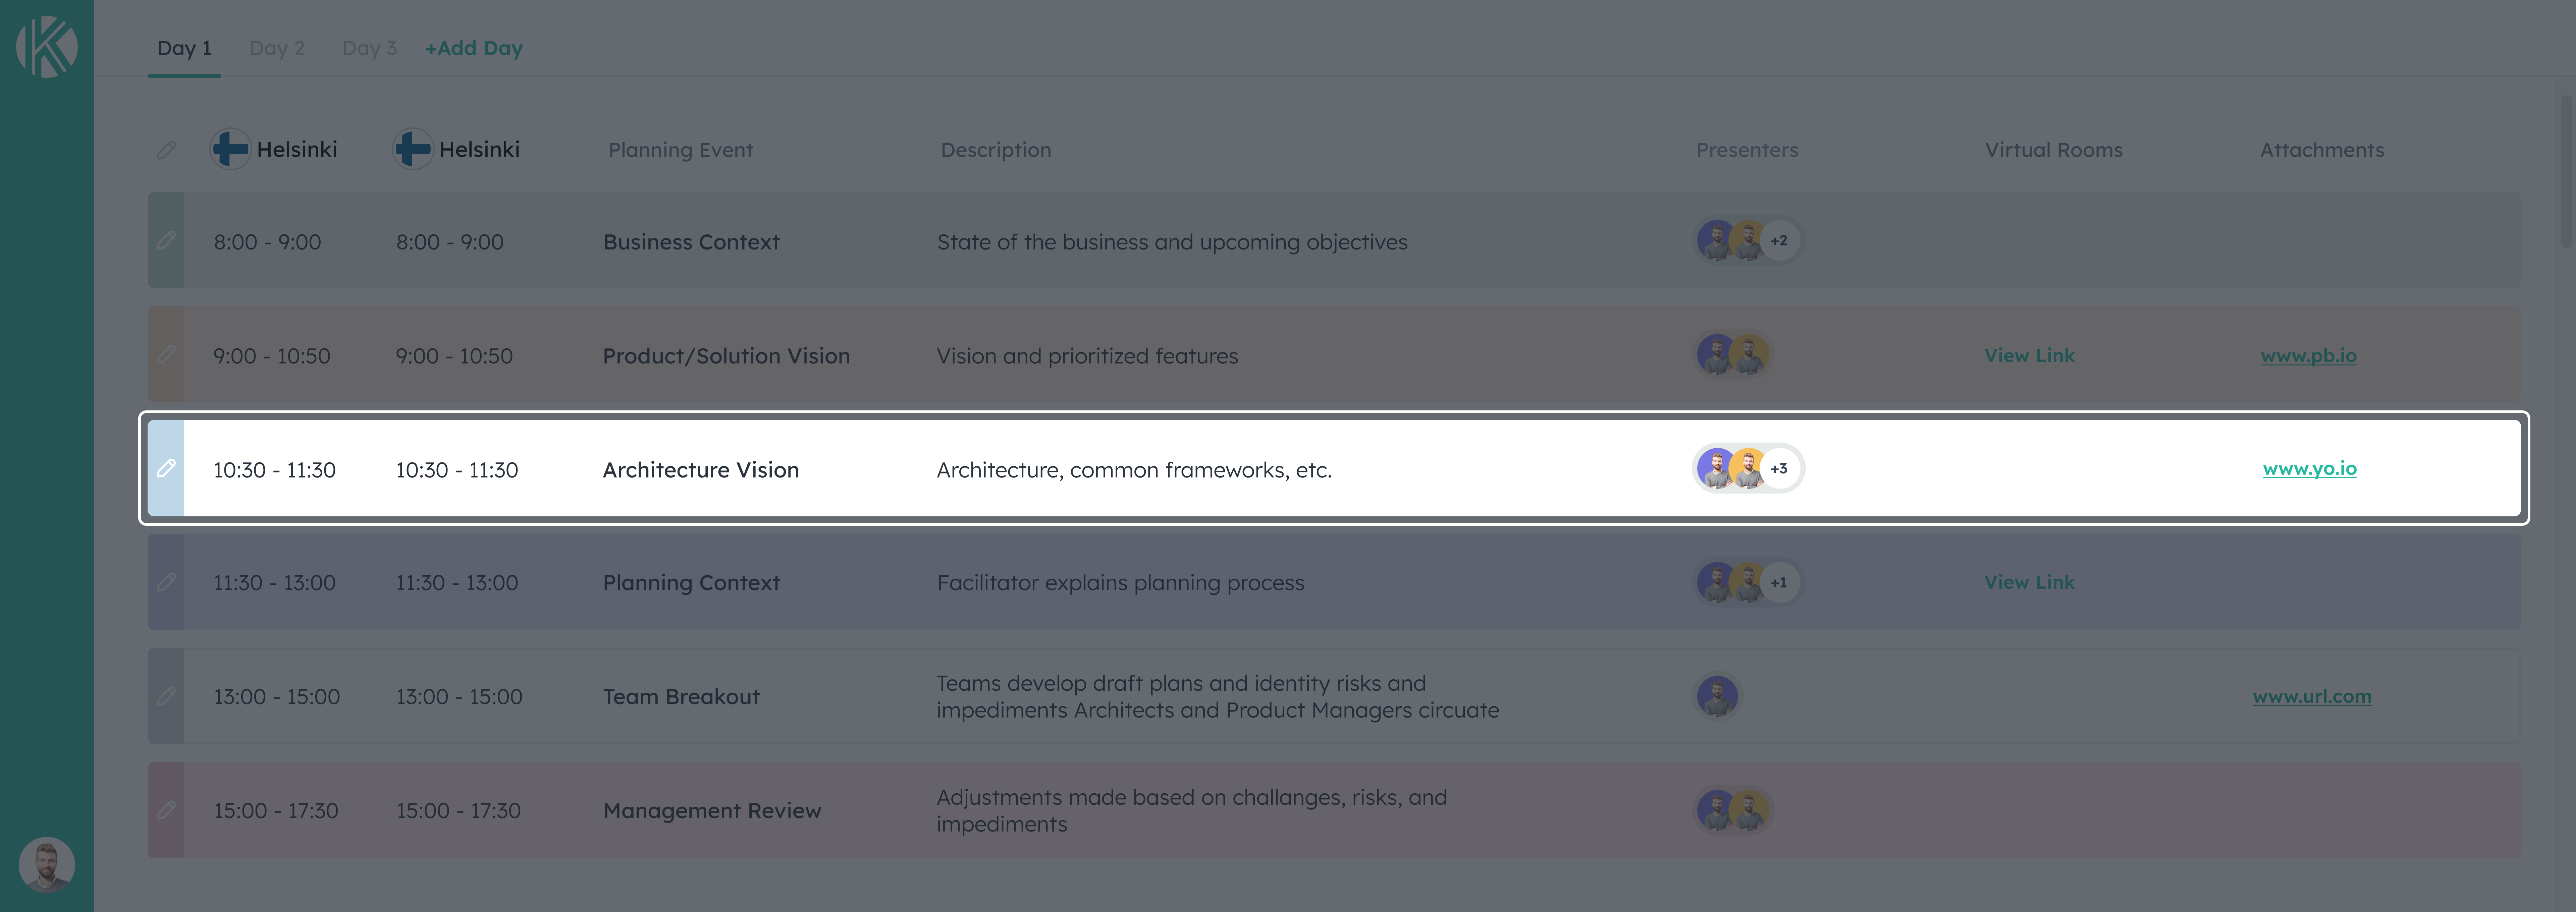
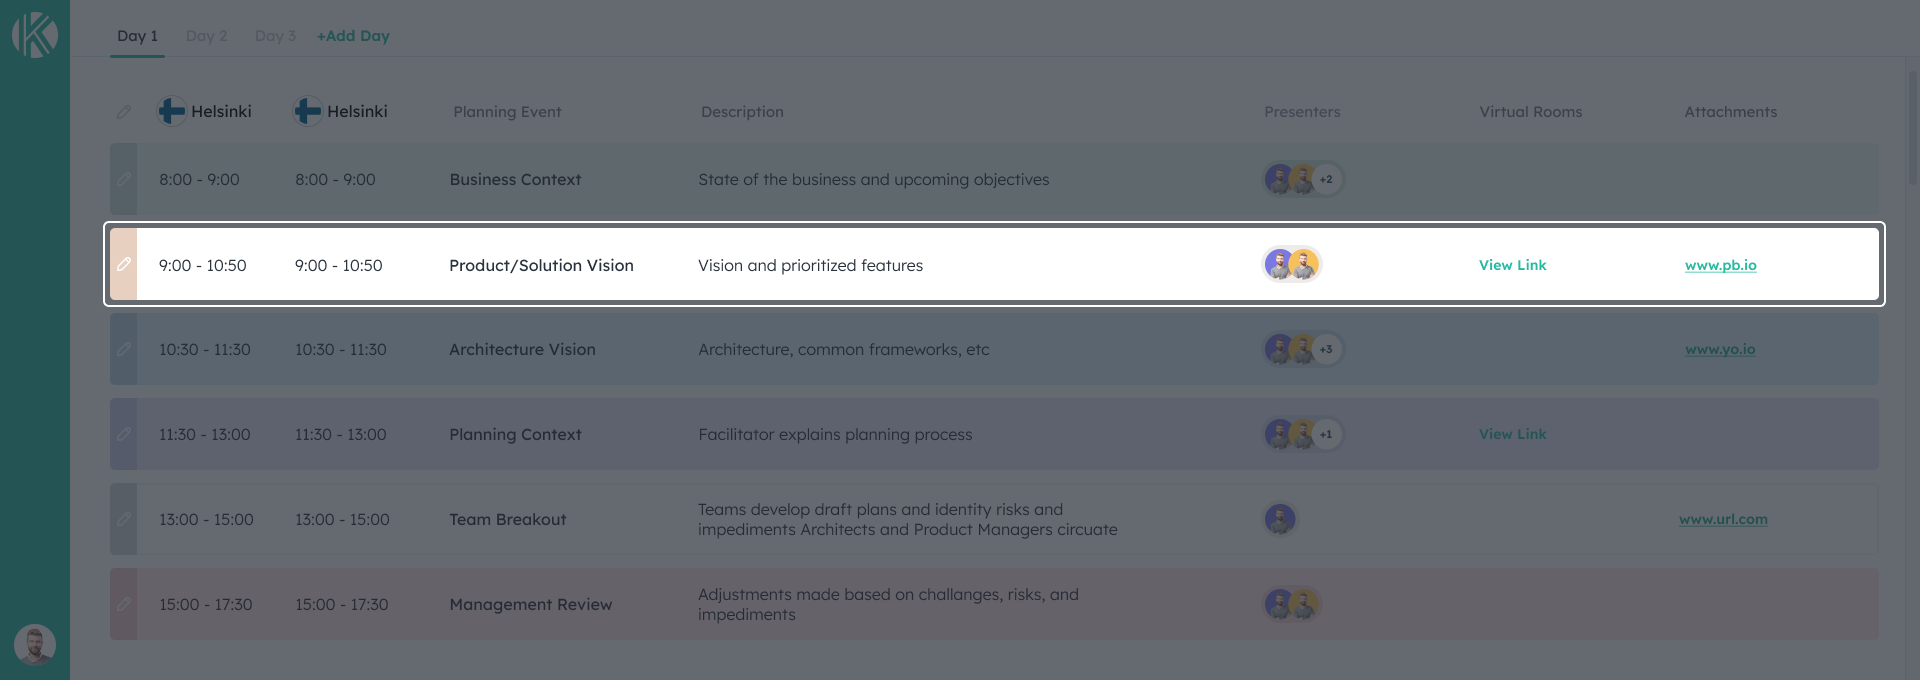
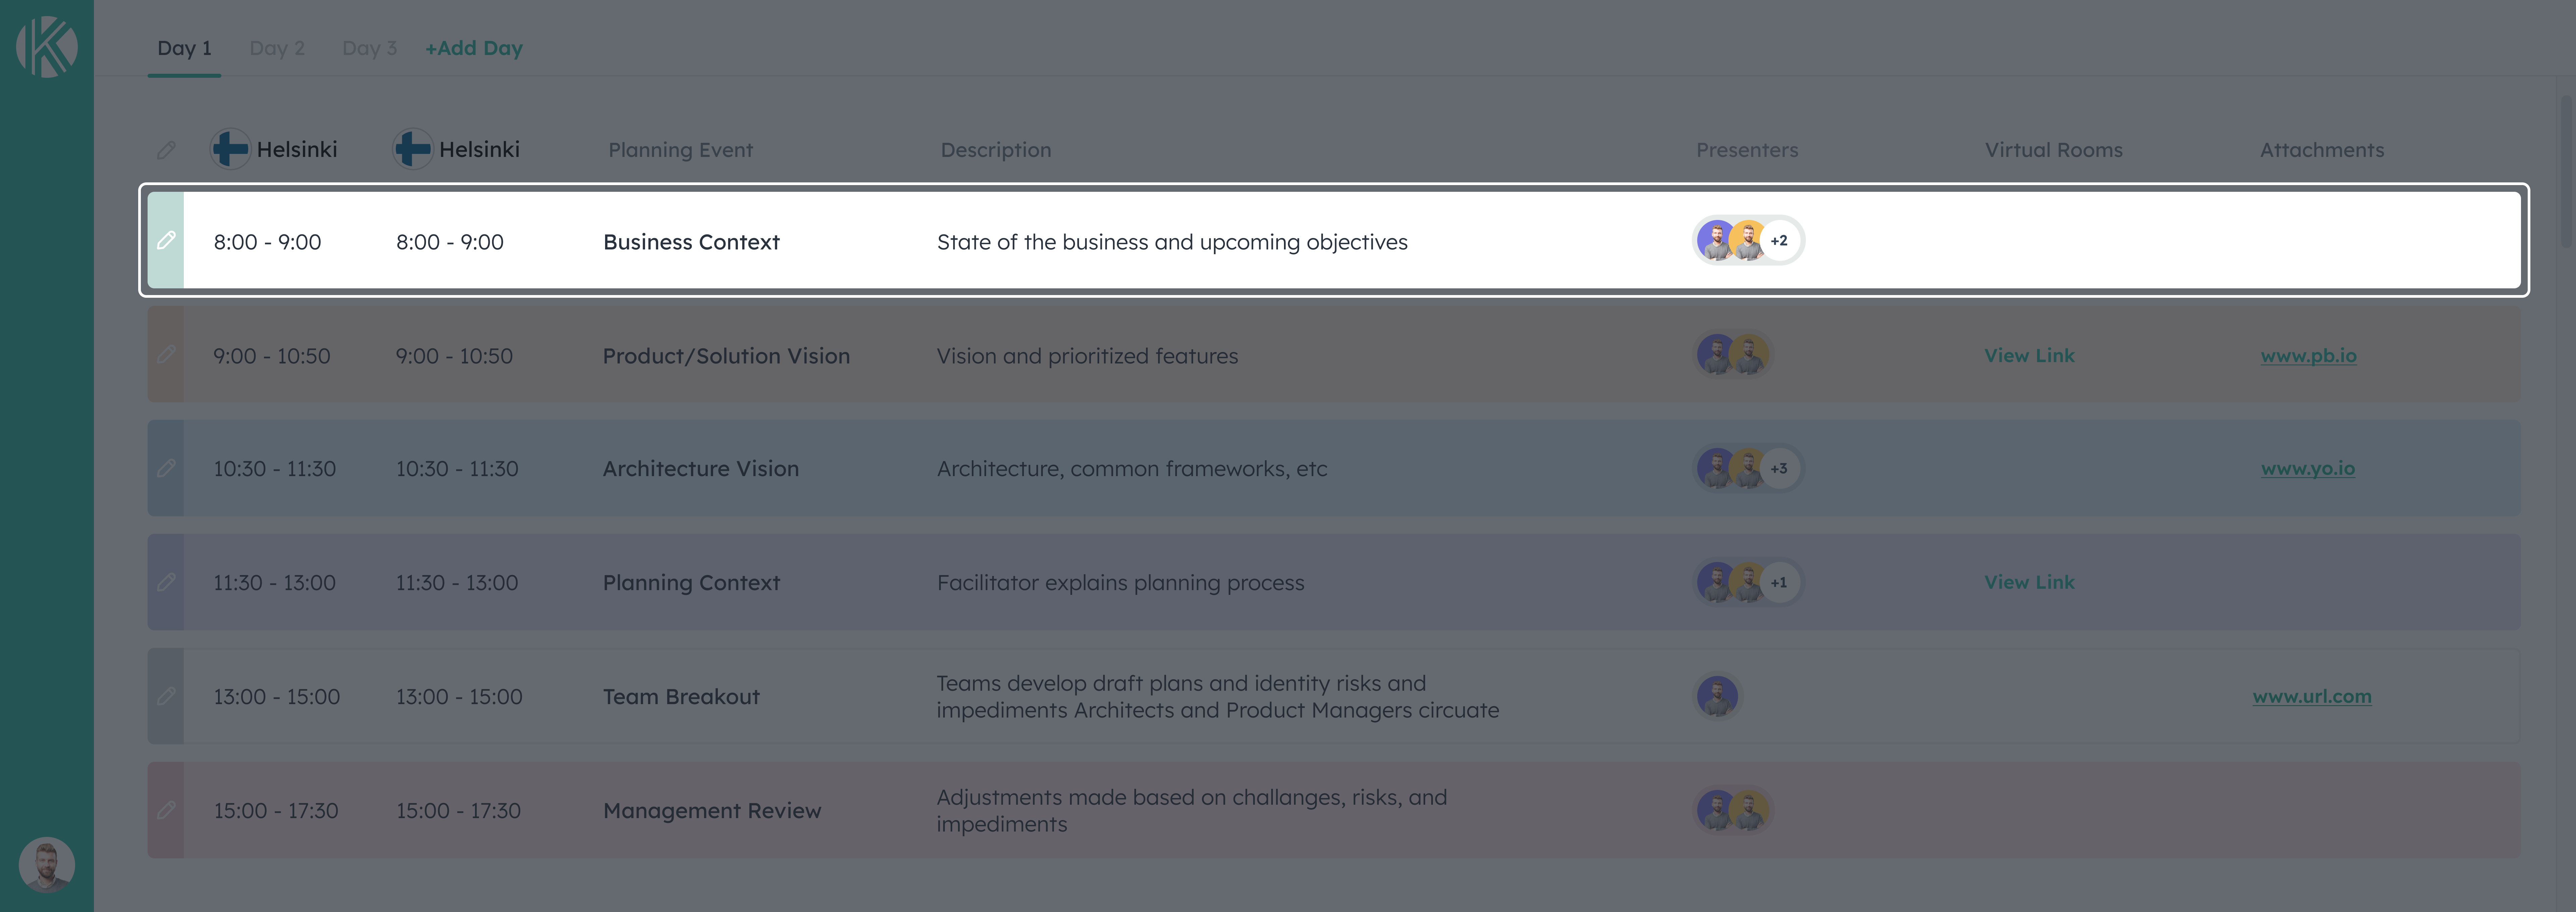
Our Scrum of Scrums feature is the solution you didn’t know you needed. It will revolutionize the way you prepare and record ceremonies with highlights and key points, a virtual room link, progress updates, and action points. For those of you that are new to Kendis, here is a quick guide to our SoS feature.
In the scrum of scrums feature you will see analytics that are based on your current Sprint. You will see the percentage of completion relating to just one Sprint. As well as being able to see the specific Objectives, dependencies for the Sprint. As you know, you are able to click on this information that Kendis provides and see the actual data.
Impediments
These are from your Scrum of Scrum sessions. Any Program or Team impediments that have been raised and closed, will show up here. If you have impediments that are still open, then you will be able to see them here.
Sprint Reports
Sprint reports at Kendis are unique. They provide great insights and data for the organizations to understand what was planned for each sprint and what actually delivered. The Sprint tracking report is in the analytics section. You can access it in the “Delivery by Iteration”. You will see at the top there is a small box saying “View report”.
It has two sections
- Program Progress: Covering the delivery of the features, user stories, dependencies, risks and objectives at the program level
- Team Progress: This section explains how each team performed against their committed plans.
You can find more details about how Sprint Reports work here.
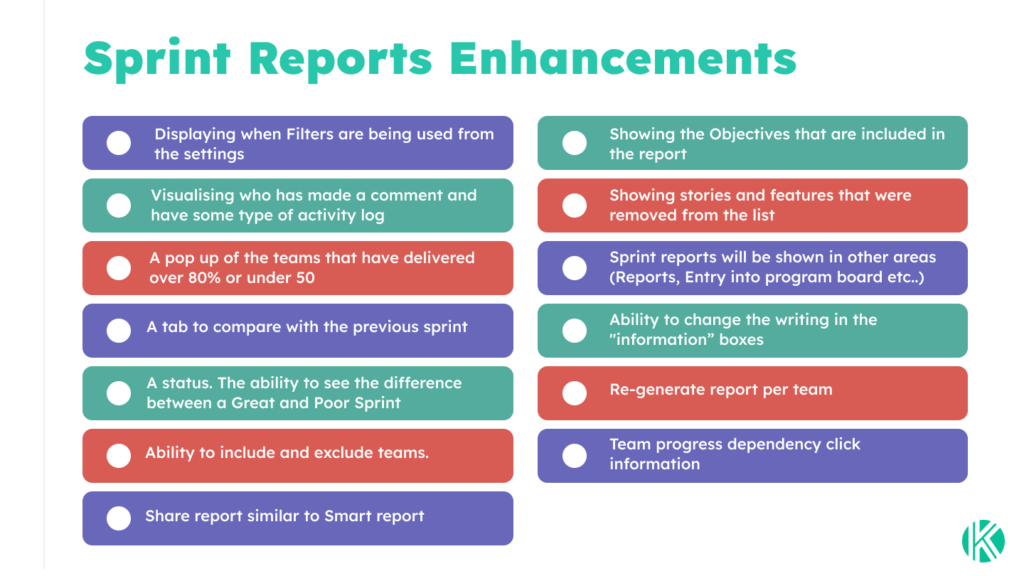
As you can see below, we have recently made enhancements to our sprint reports that had been widely requested.
In Conclusion
Kendis Sprint Tracking empowers you to take tracking to the next level with a multitude of unique features. Enhanced analytics, scrum of scrums facilitation, dependencies, risks – just to name a few. the best part is that this is all linked to your ALM tool with two-way integration, meaning we are reducing the work and amount of different tools that you use everyday.
To delve deeper into this topic, view the recording of our Sprint Tracking Clinic below. You can also book a demo or start a free trial at kendis.io.