Here we discuss the scenario where your goal is to maximize the Value, by means of Inspect and Adapt (I&A) ceremony as an effective and valuable natural progression of an iterative process.
This is where Kendis comes into the picture.
What Can Kendis I&A Module Do For You
In an earlier post we shared a brief on Inspect and Adapt strategy and procedure. In this post, we’re going to share how Kendis facilitates this relentless improvement and provides you with enough actionable material for your Retrospectives or Problem-solving workshops.
With Kendis you can review every PI Board comparatively, conveniently and visually, in your time-boxed, auto-powered Inspect and Adapt exercise.
The key aspects of the I&A ritual are:
Information Synthesis, Tracking, Review, Evaluation, Feedback, Prediction, and Improvement.
Put simply, it is an exercise in accountability that leads to relentless improvement. Kendis Inspect & Adapt module carries this out through the following sections:
- Program Performance Report
- Program Delivery Report
- Program Predictability Matrix
- Program Performance Measurements

On top of this, it offers full user and access control management with:
- Flexibility
- It is a time-boxed event (minimum duration is 45 minutes)
- The session can include as many previous PI Boards as required
- Any number of variables that can be selected to measure the Program Performance:
- Goals
- Risks
- Features
- Enablers
- Any other selected card type
- Zero additional configuration
- Two-way real-time sync
- REST API and Webhooks
How can a digital solution be this complete without being complex, you must be wondering!
Let’s get to work and see for yourself!
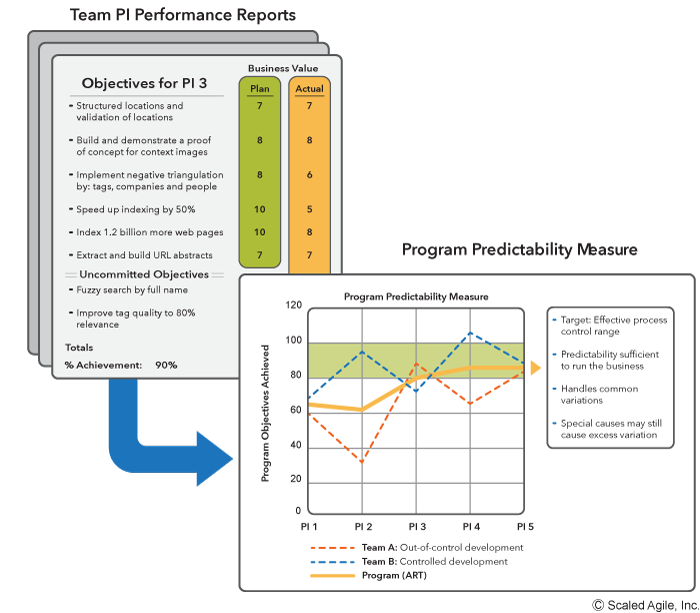
Business Value
The first order of business is figuring out the business values achieved for PI Objectives by each Team. Composed of two values, the business value metric establishes a common language for communication between the business and technology stakeholders.
For assessing each team’s contribution to business value, Planned business value (value assigned to each Objective during PI planning) is compared against the Actual business value (value assessed upon delivery) to measure ART’s performance, and the business value achieved.
This could be a time-taking and taxing process, involving extra preparation from the RTE and Product Management Team.
However, Kendis synthesizes the data from the Objectives module which tracks all the work done in your PI for each Feature by each Team, every Sprint along the way.
Program Performance Report
The Program Performance Report section documents and tracks team performance against each Team’s every Objective. Providing a wholesome picture for all ART stakeholders, the tracking is done using a range of aspects of the PI:
- Team story status
- Team story point count
- Feature status
- Feature story point count
Setting as many metrics as you need, you can filter each Team’s committed and uncommitted Objectives completion percentage at the Board. This helps you measure all that which you need!
This adds a layer of flexibility and convenience, without compromising the finesse of your I&A session.
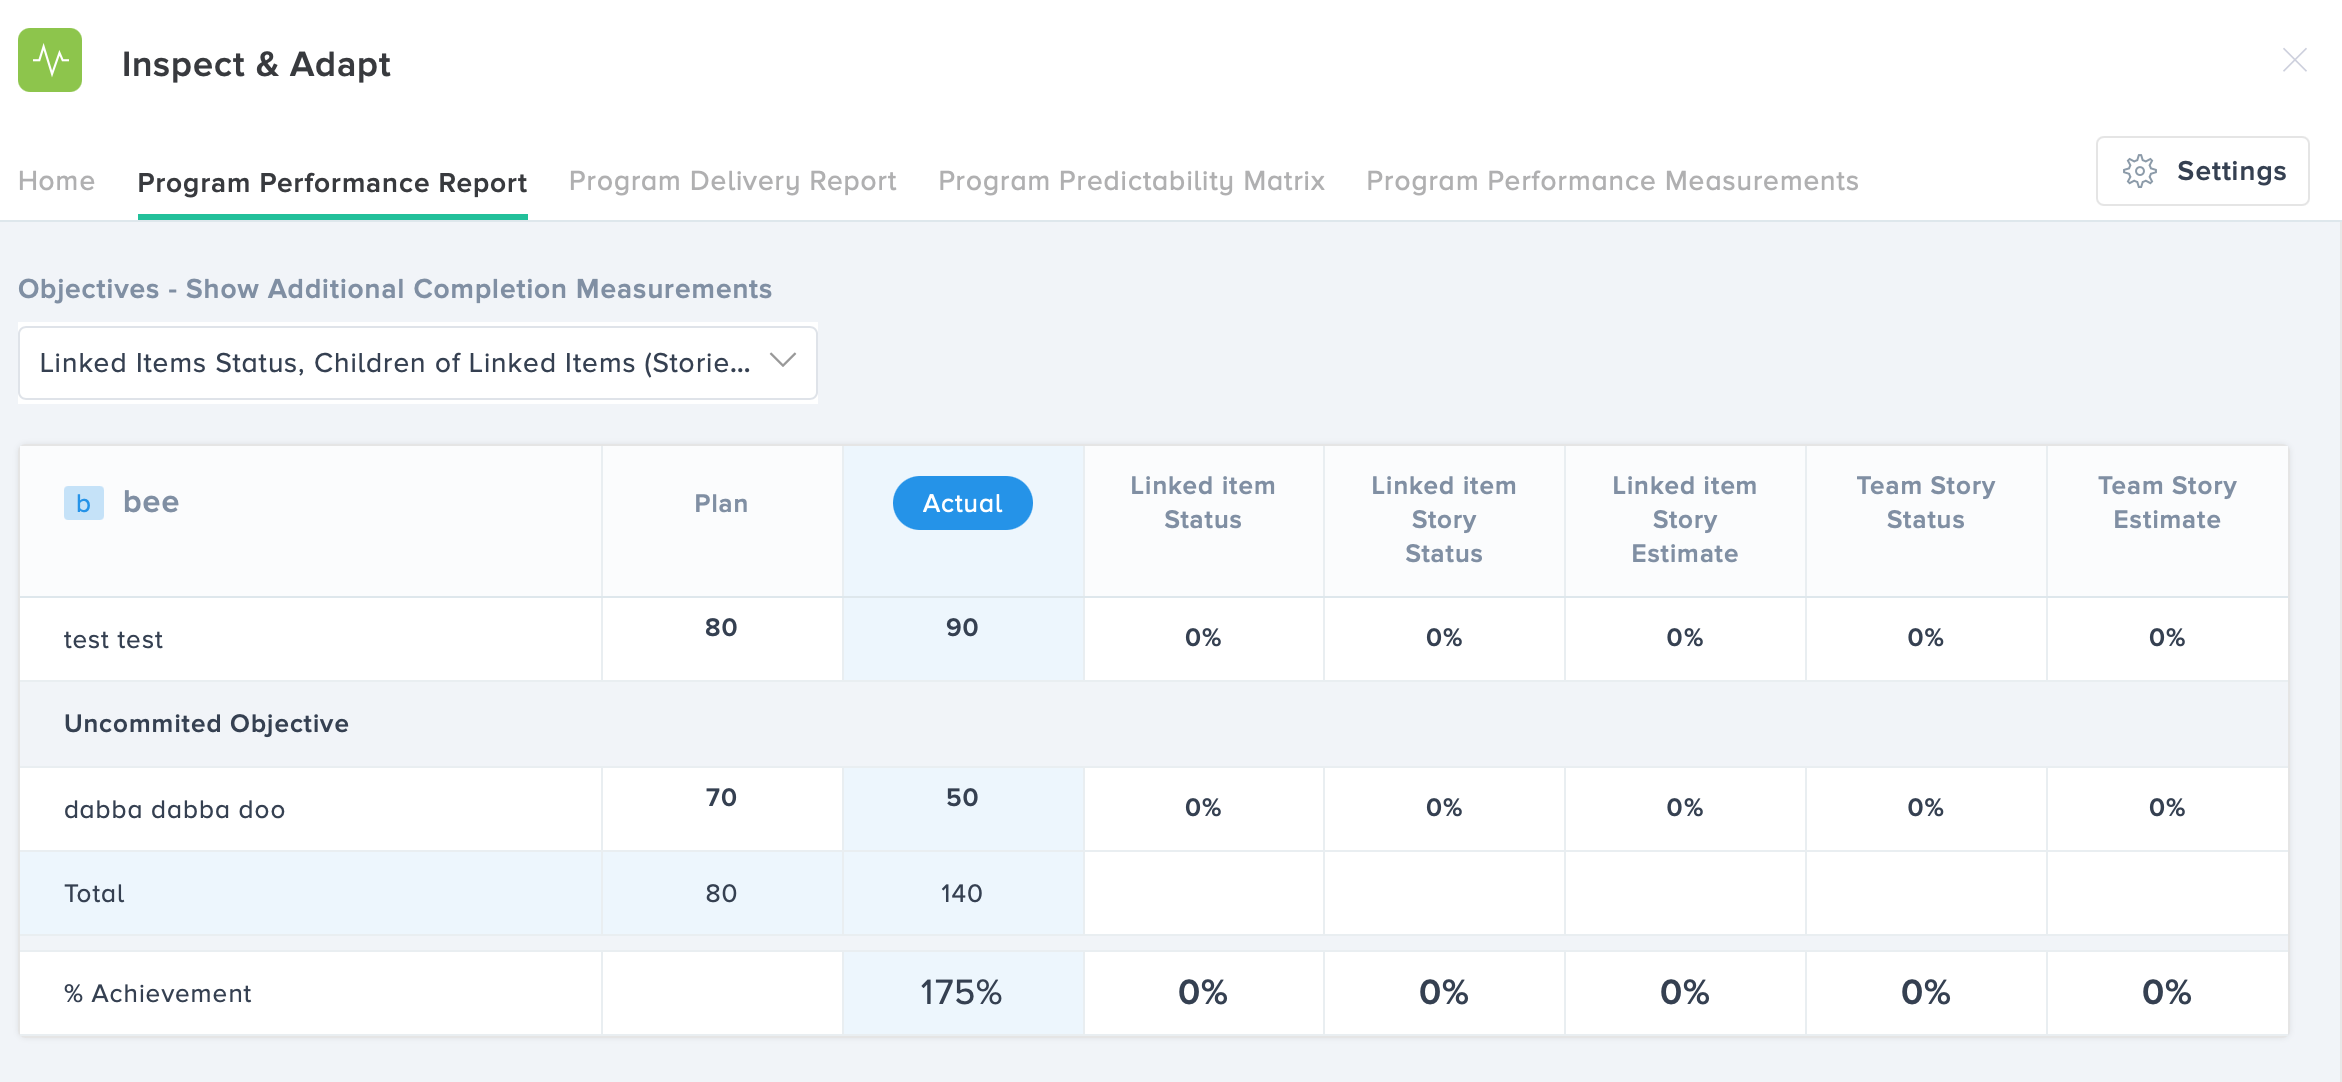
Kendis automatically calculates business value achievement using this formula.
% Achievement = (Actual Business Value / Planned Business Value) * 100
Predictability
The comparison of Planned vs Actual business values (BV) of the Objectives calculated comprehensively ensures that all the players get a 360° picture of the teams performance, complete, candid, and transparent.
This, then, enables a direct comparison of your current PI Objectives against previous PI Objectives to have a historical context of the progress being evaluated.
It is calculated by rolling up each team’s planned business value against the actual business value. The program predictability measure is the cornerstone of this stage of the SAFe Inspect and Adapt event.
Program Predictability Matrix
Measuring this is important because SAFe prescribes that reliable trains operate in a range of predictability measure that varies between 80-100%. This is the most optimal range of predictability measure allowing the stakeholders to plan effectively, while maintaining enough fluidity and ample structure, keeping in line with the key SAFe principles “Assume Variability-Preserve Options”.
Now, serving the needs of the Release Train Engineer and the Solution Train Engineer Kendis offers a single click at the Program Predictability Matrix that collects all the required data from the relevant boards and presents the findings in a single-view easy format for the ART stakeholders to collectively review.
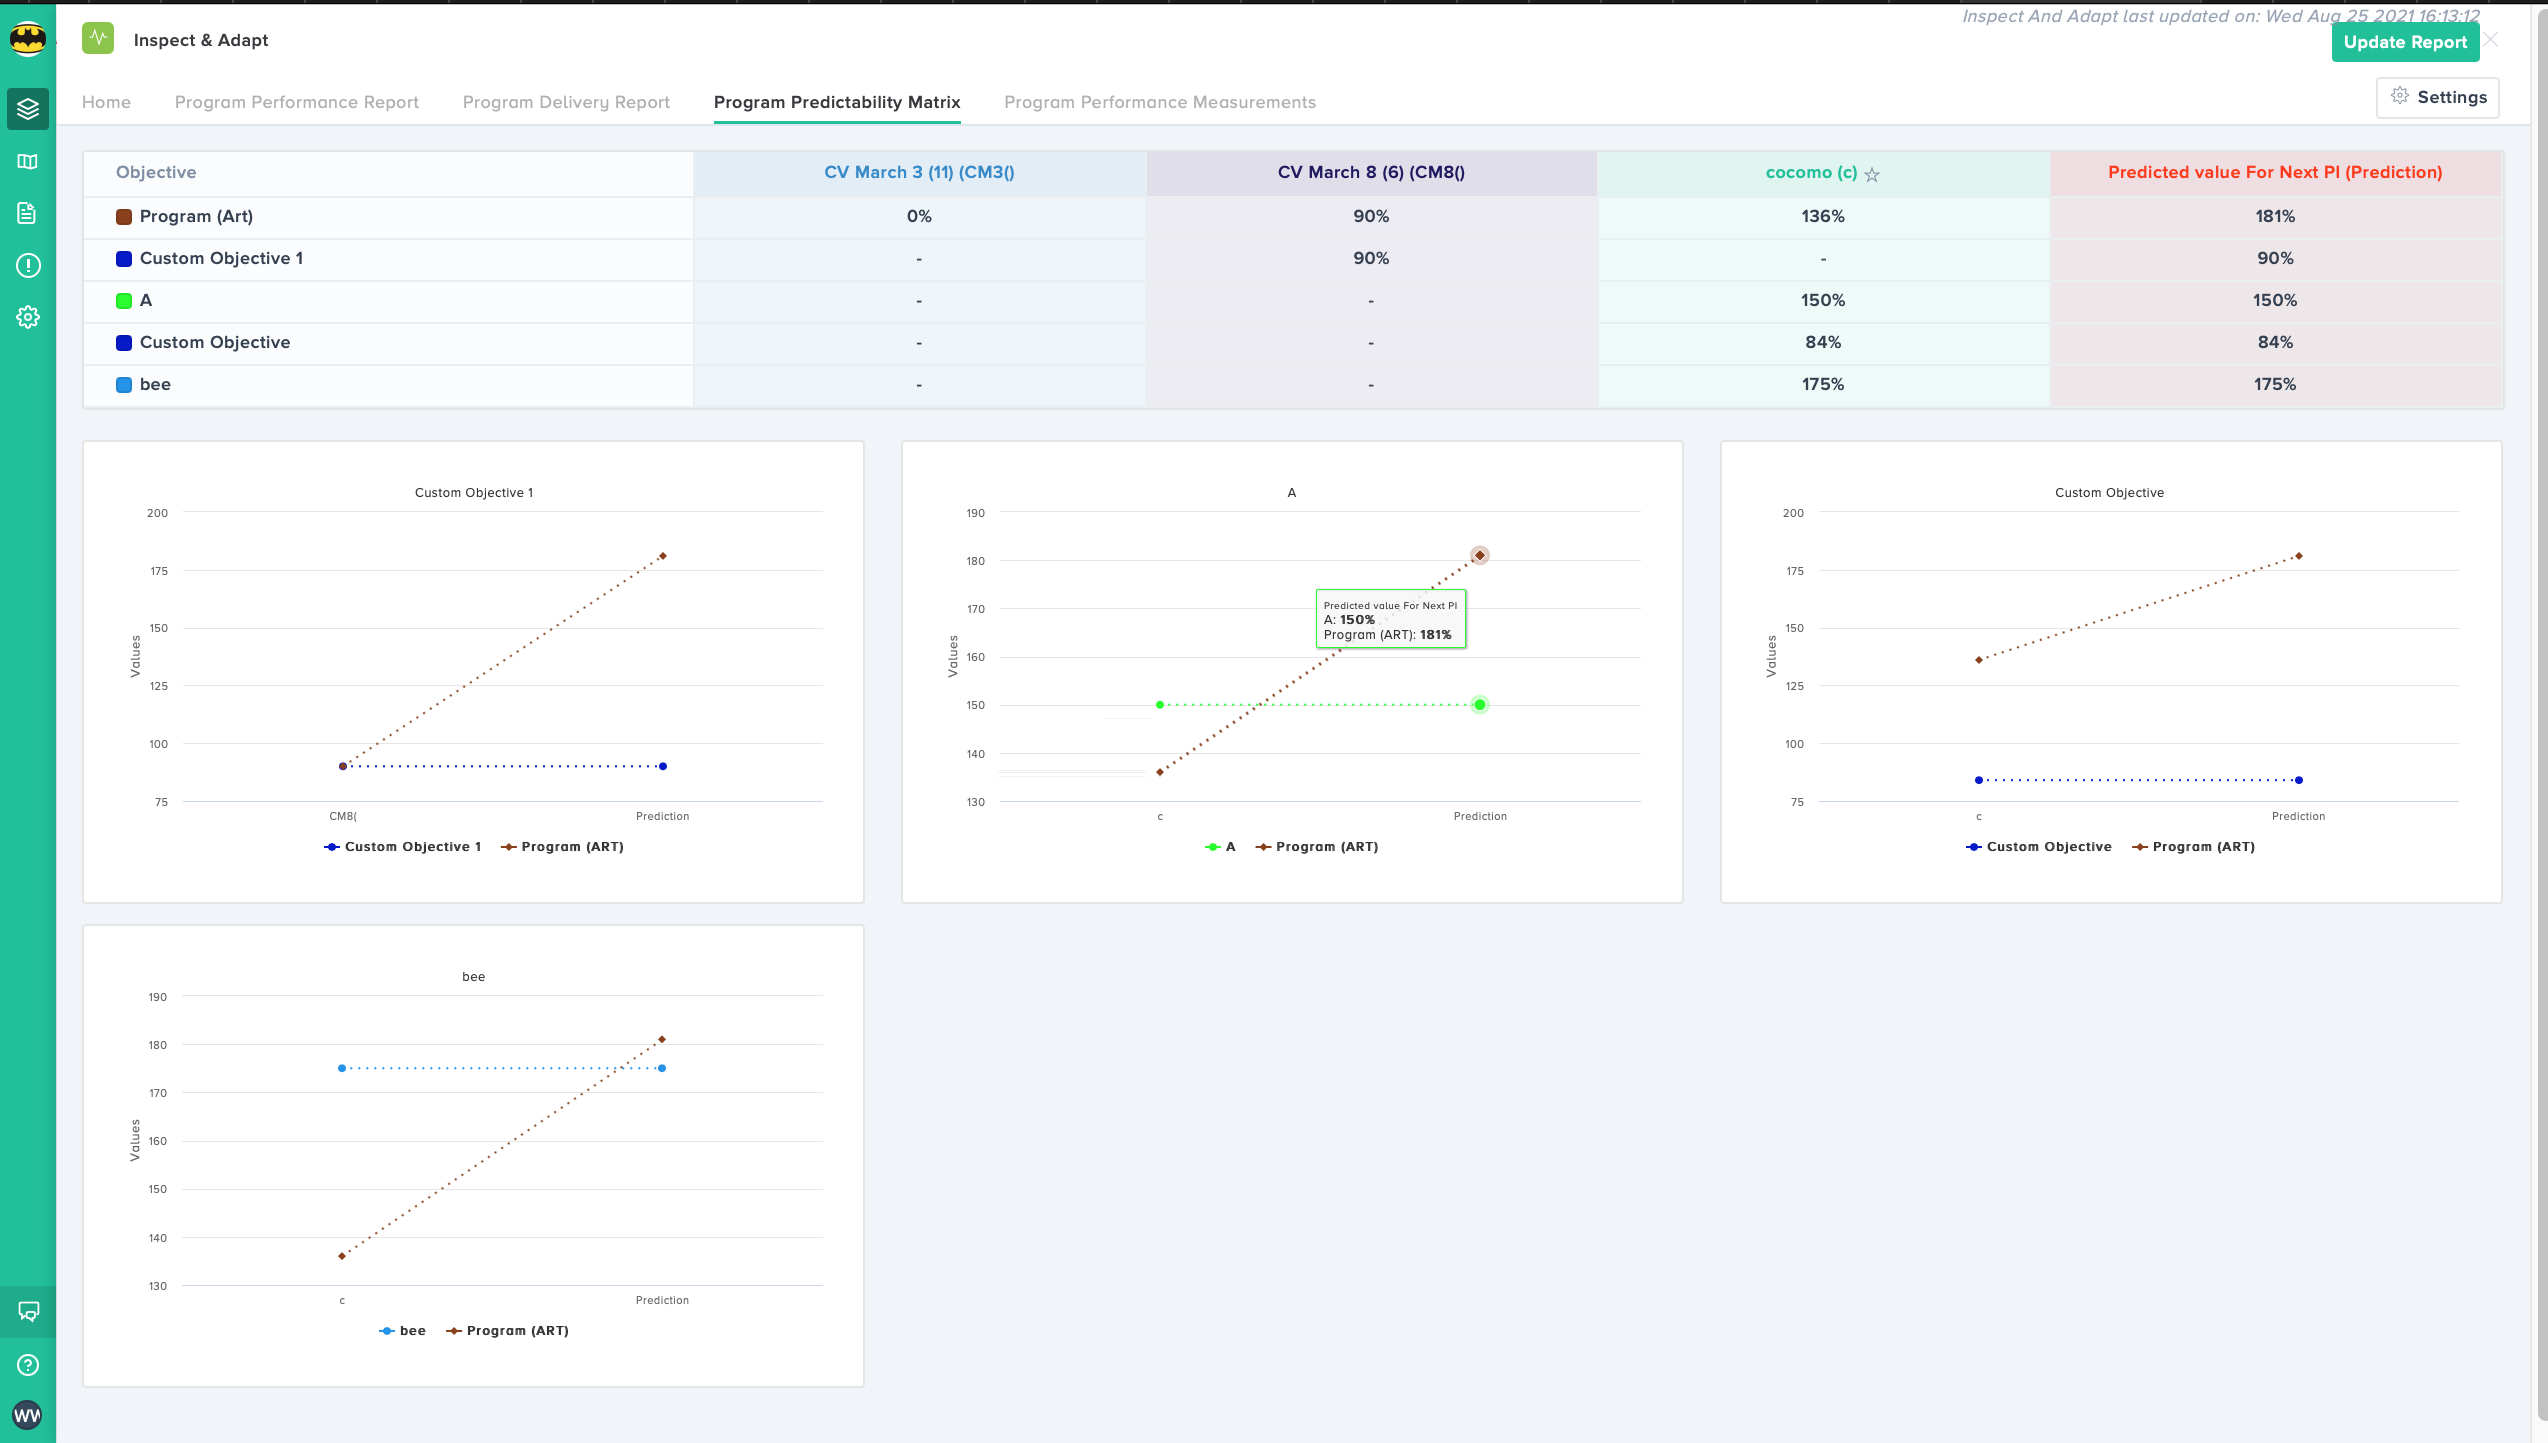
Each individual Objective is separately tracked against the Program Objective completion value, providing you a razor-sharp focus on the individual relationship of each Objective to Program ART.
Kendis Inspect and Adapt algorithm predicts the percentage value for each Objective completion in the next PI.
Delivery Analytics
Analyzing the delivery status of the ART is at the heart of a meaningful Inspect and Adapt experience with a focus on not only the Done status but also on what has NOT been done: the dreaded scope creep throughout the Increment and the dependencies that did not get completed, causing inevitable delays to the Program delivery.
Program Delivery
Inspect and Adapt tracks all the scope changes that Features, Stories, and the Story Points underwent. If you’re regular at our blog, you may have already read our earlier post “Single view to track Scope Changes during and after PI Planning” which explains how Kendis gives the complete view of your entire Program Increment (PI) or sprints through various states on its highly customizable boards, in the Comparison Report feature. In the I&A module, however, we keep the attention focussed on the things that matter: Features, Stories, Story Points, Scope changes and dependencies, only.
Here you find a clickable, detailed breakdown of:
- Feature Delivery Variations and Sprint Planning Variations (documenting the stories which changed their sprints)
- Each team’s progress in terms of its Feature completion. It provides progress data of every team’s features
- Each team’s progress in terms of its Stories, and Story Points completion.
As you can see, the entire ART delivery is summarized into three graphs which are easy to read, simple and auto-generated.
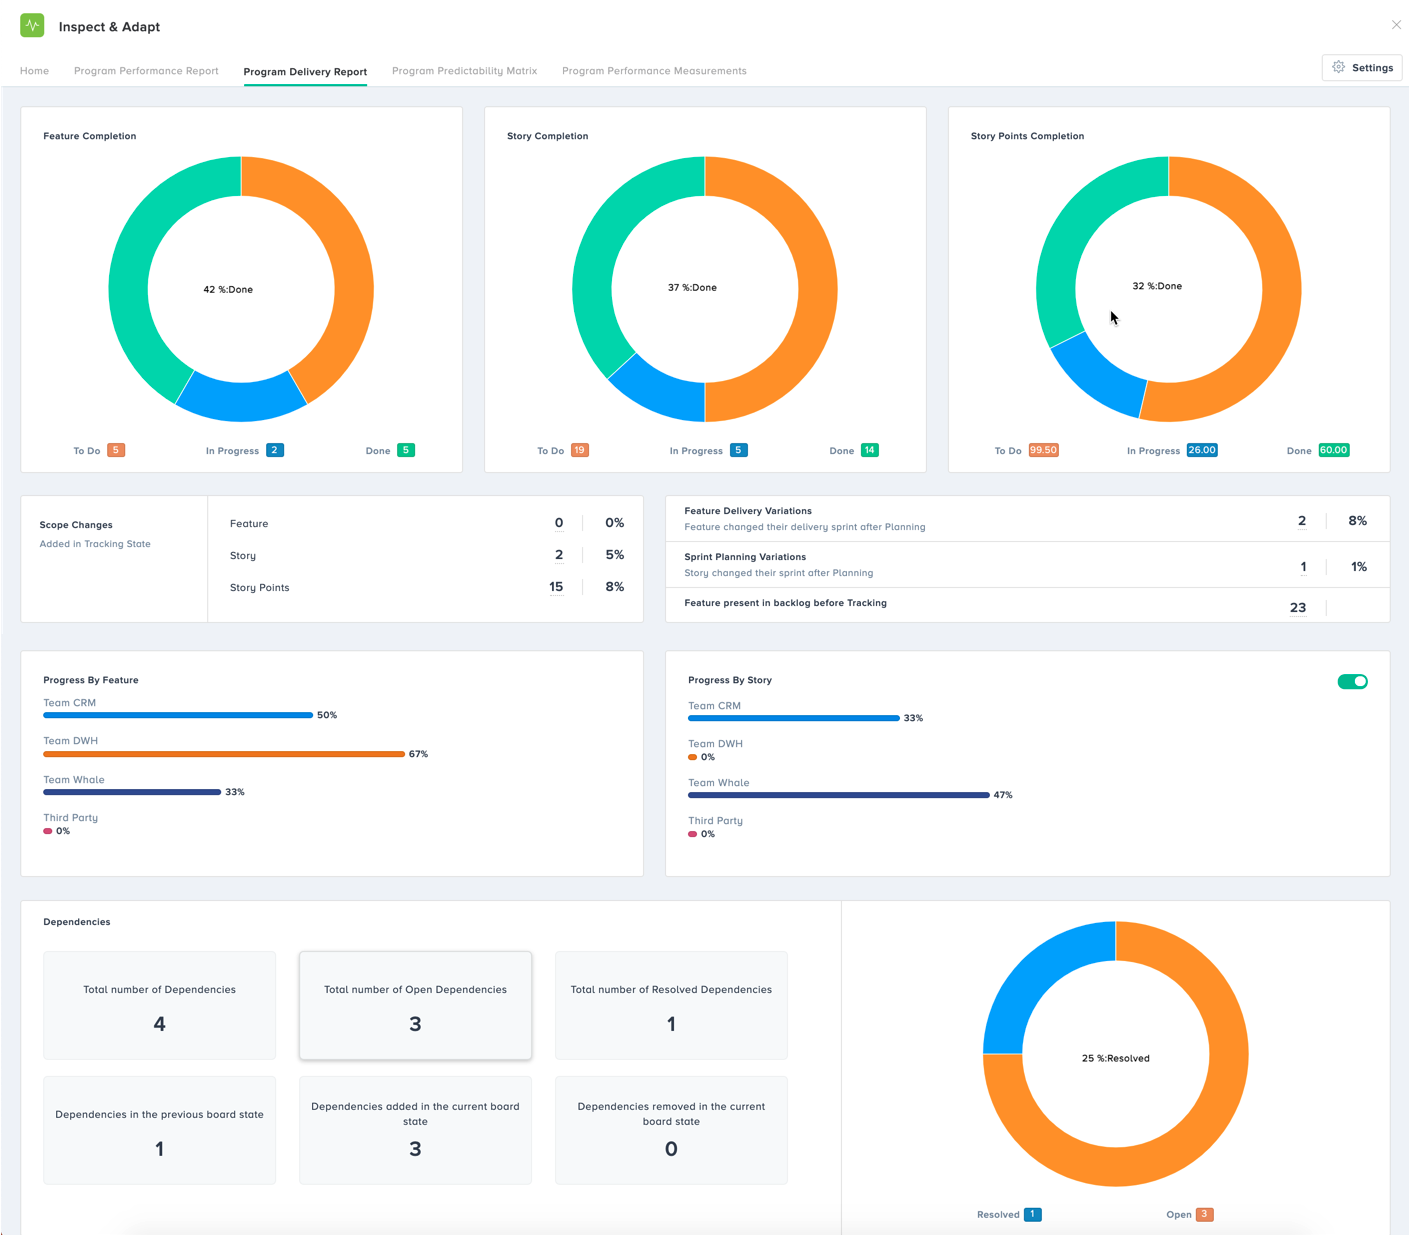
One of the most significant aspects of the Kendis I&A Program Delivery is the summary of the Dependencies through the Program Increment. This insight when brought to a Problems Solving Workshop of eager participants, optimizes the session performance.
This range of attributes helps assess your needs, wants, strengths, weaknesses, problem resolution, state of performance, the situation of the dependencies, conditions for ROAMing the risks, and future forecast without any confusion complicating your processes.
It ensures that any and every aspect of your increment is taken into consideration and effectively responded to. Imagine the ease, accuracy, and transparency this adds to your I&A.
TLDR: 9 Ways Kendis Inspect and Adapt Serves You
 Automatically calculates the Planned and Actual business values for each Feature throughout the PI, providing the Business Value Achievement
- Tracks team performance against each Team’s Objectives
- Provides a historical context of the progress by comparing your current PI Objectives against any previous PI Objectives
- Presents the Program Predictability Matrix in a single-view, easy format for the ART stakeholders to collectively review
- Predicts the business value for Objectives to be delivered by the Team in the next PI
- Summarizes the delivery status of the ART in smart, simple, and auto-generated graphs
- Tracks and documents a clickable, detailed breakdown of Sprint Planning Variations, and all the scope changes that Features, Stories, and the Story Points underwent throughout the PI
- Provides a single view of all the progress made during the increment: Features, Stories as well as Story Points, summarizing the PI’s performance
- Presents the dependency relationships between teams throughout the PI
Crystal balls may not be real, but a reflective Inspect and Adapt exercise held with Kendis is no less than one. Test our claim. Here’s your chance!