Kendis provides many great capabilities to make your remote PI Planning experience super easy and engaging.
Once you finish your Quarterly/PI Planning, the next step is to find ways to make your PI Tracking as automated as possible.
In your own Agile tools, Jira or Azure DevOps tracking is mainly designed around one team and one sprint at a time. You may build your dashboards for longer periods, but they don’t really reflect how you have planned your PI, which is designed around a matrix of Teams and Sprints.
Kendis has many capabilities that significantly improve your grip on tracking the PI execution. We will be writing a series of blogs to help you understand in depth these capabilities one by one.
The topic for this blog is to understand how the Timeline view at your Kendis board would help.
What is Timeline?
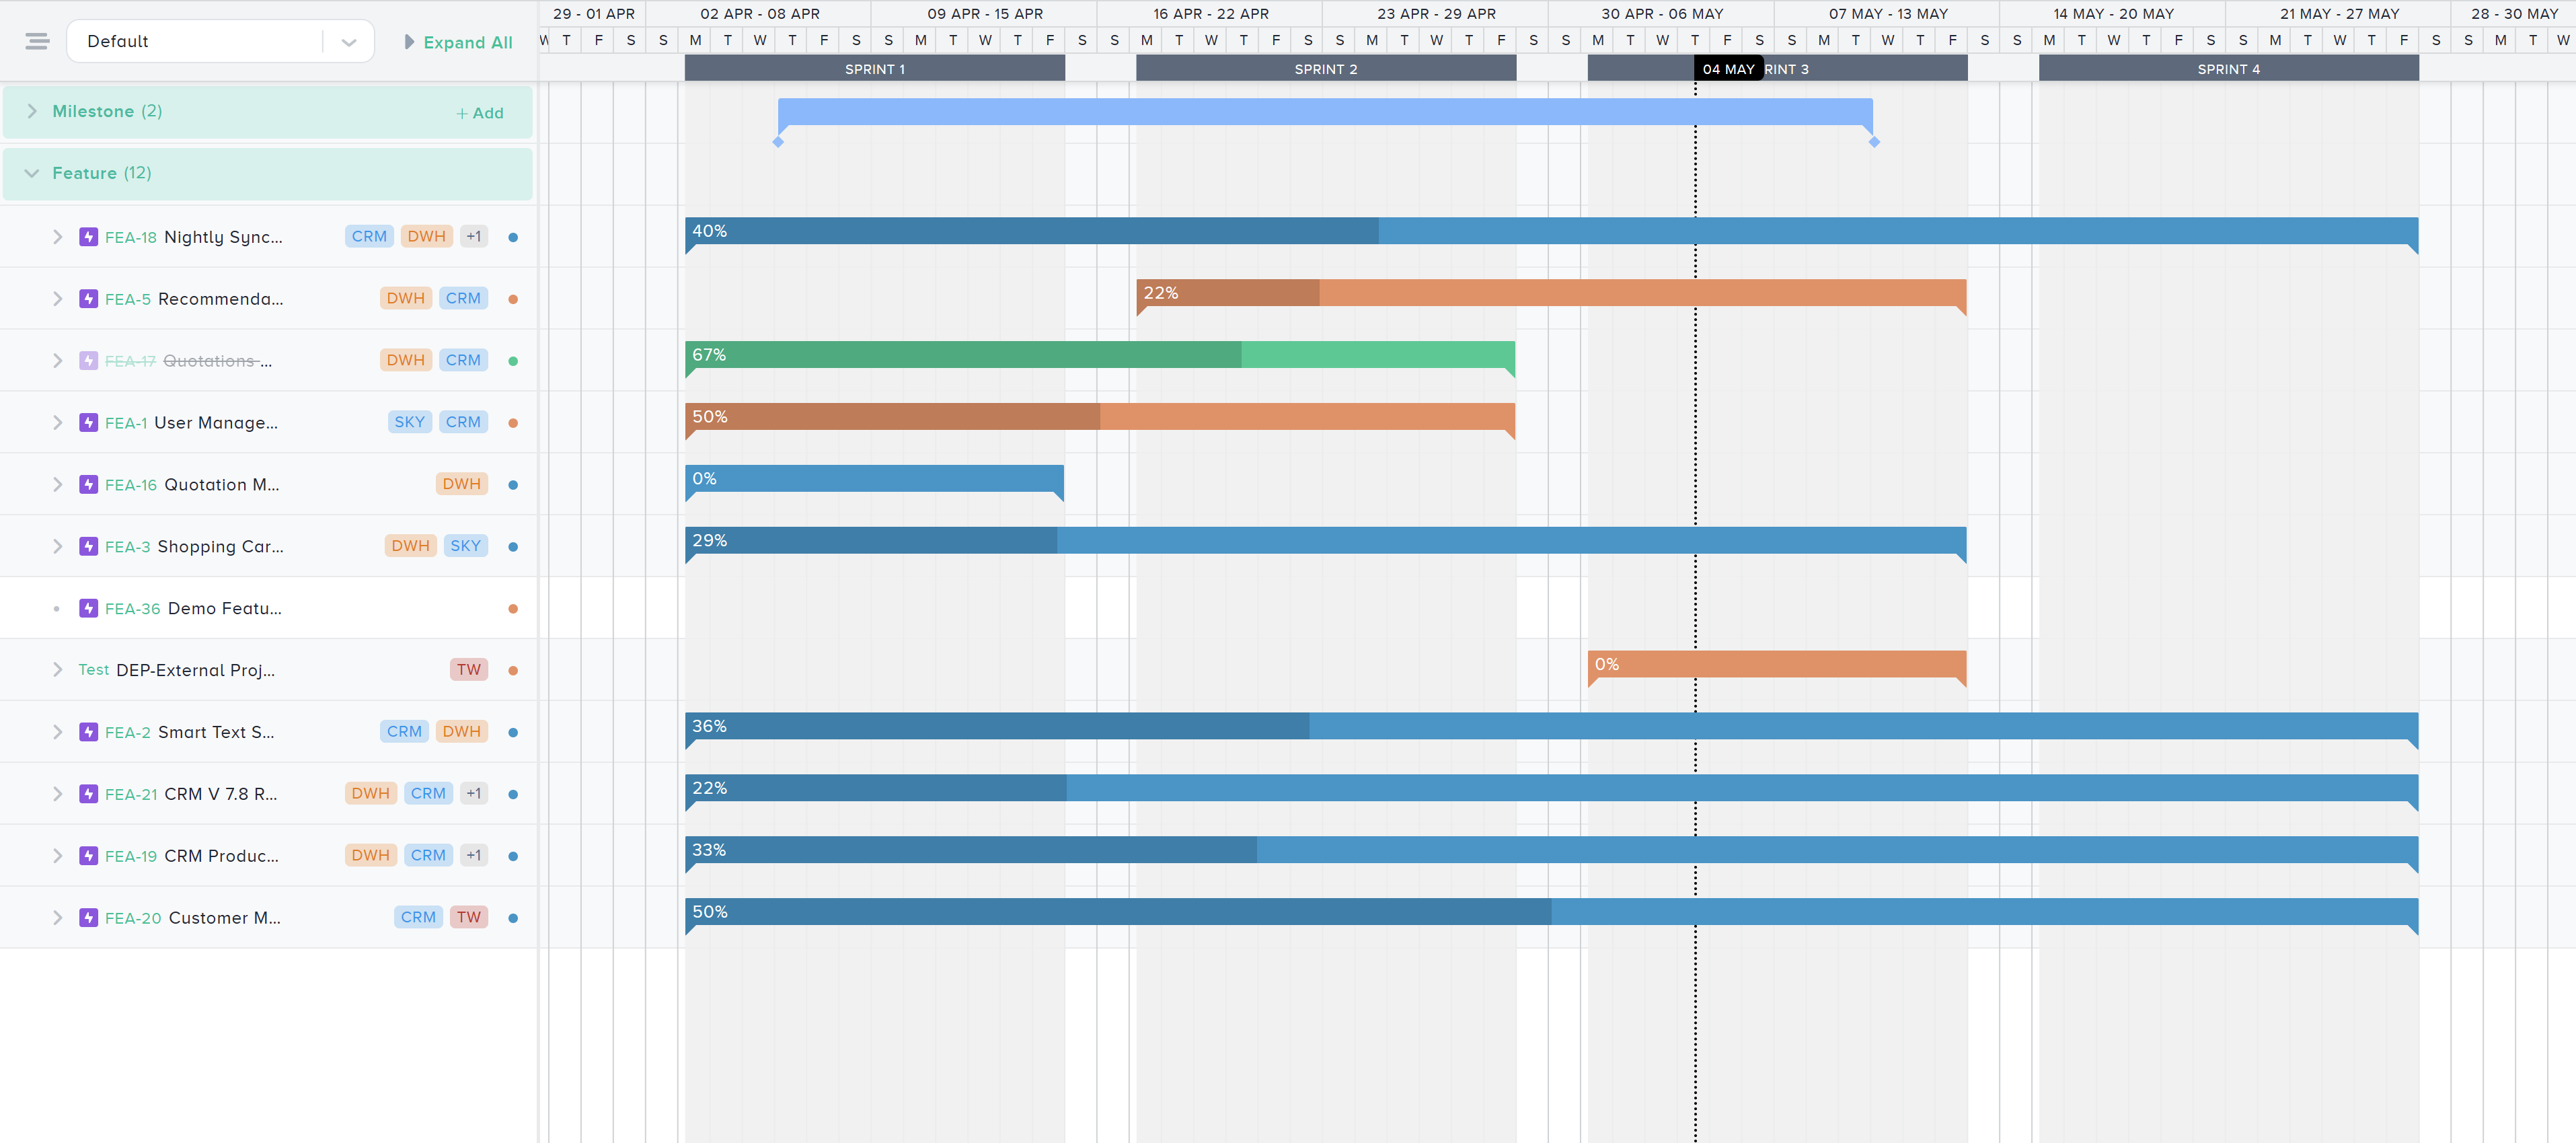
Timeline is a Gantt chart-style view that shows data mapped over the time axis.
As the PI progresses, the completion of the feature becomes an important topic. The timeline view is perhaps the simplest view to understanding how well the features are progressing and if any measures need to be taken into consideration to de-risk the feature’s completion.
Keypoints
- The default view is “By Sprint”, and it draws the features based on the stories planned in the sprints. It picks up the start and end dates of sprints.
- Expand each feature to view the stories.
- Stories are sorted based on the sprints.
- Unplanned Stories means they are not in any sprint yet, they will be at the end of the listing.
- Percentage Completion on each feature bar is calculated based on the number of stories Done / Total stories in each feature.
Tip: To view progress based on the “Planned Stories – stories that are in one of the sprints on your board”, use the filter option.
Search → More Filters → Story Filter (Planned/Unplanned) → Planned
Save this filter as “Quick Filter,” so it is accessible to everyone on this board.
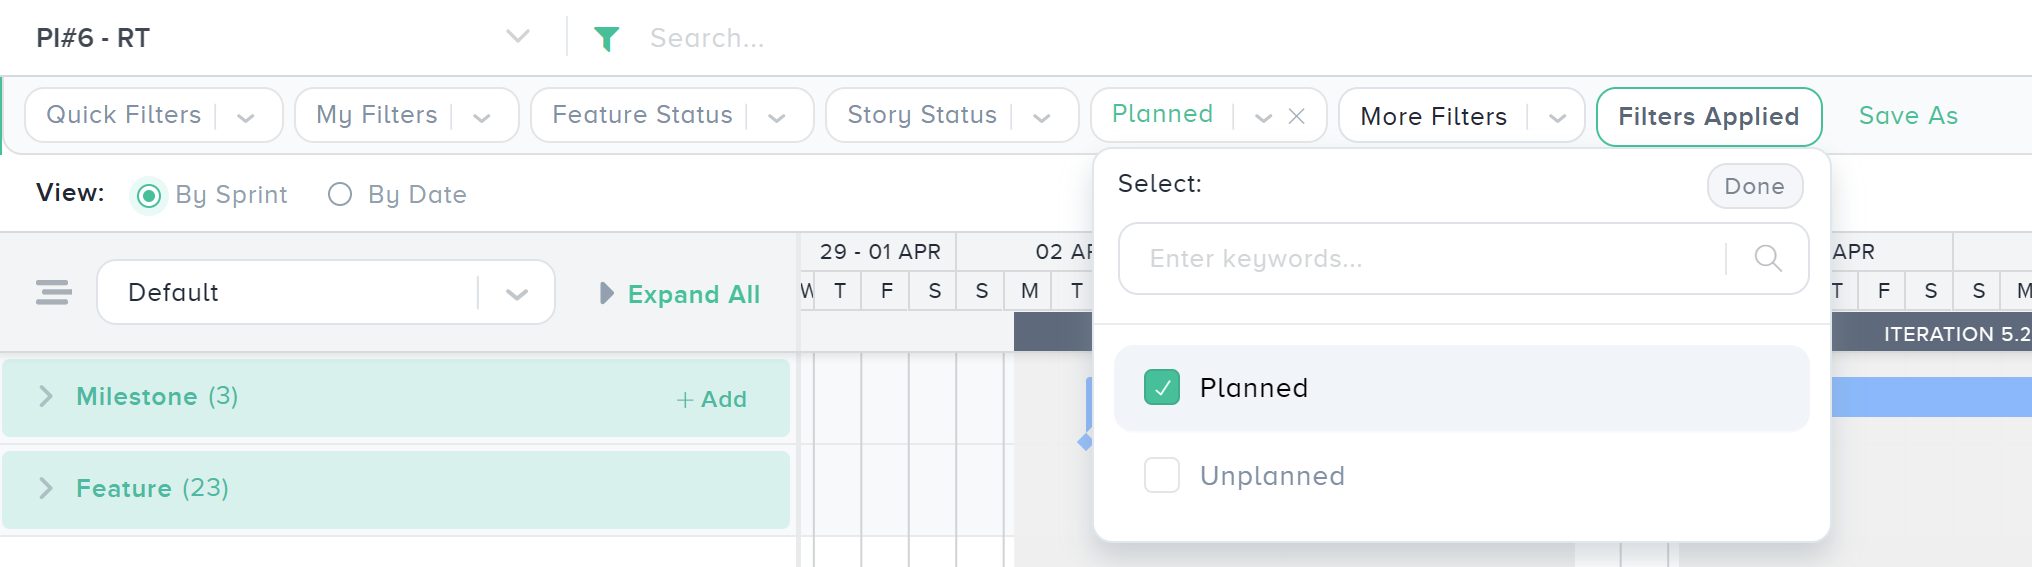
% Completion will now reflect based on the planned stories.
Group By Options and Why They Matter?
The true power of this Timeline view is the “Group By” options available. Each Group By option, brings a unique perspective and insights.
A few important Group By options are explained below.
- By Team (Planned Stories)
- By Milestone
For Jira Board
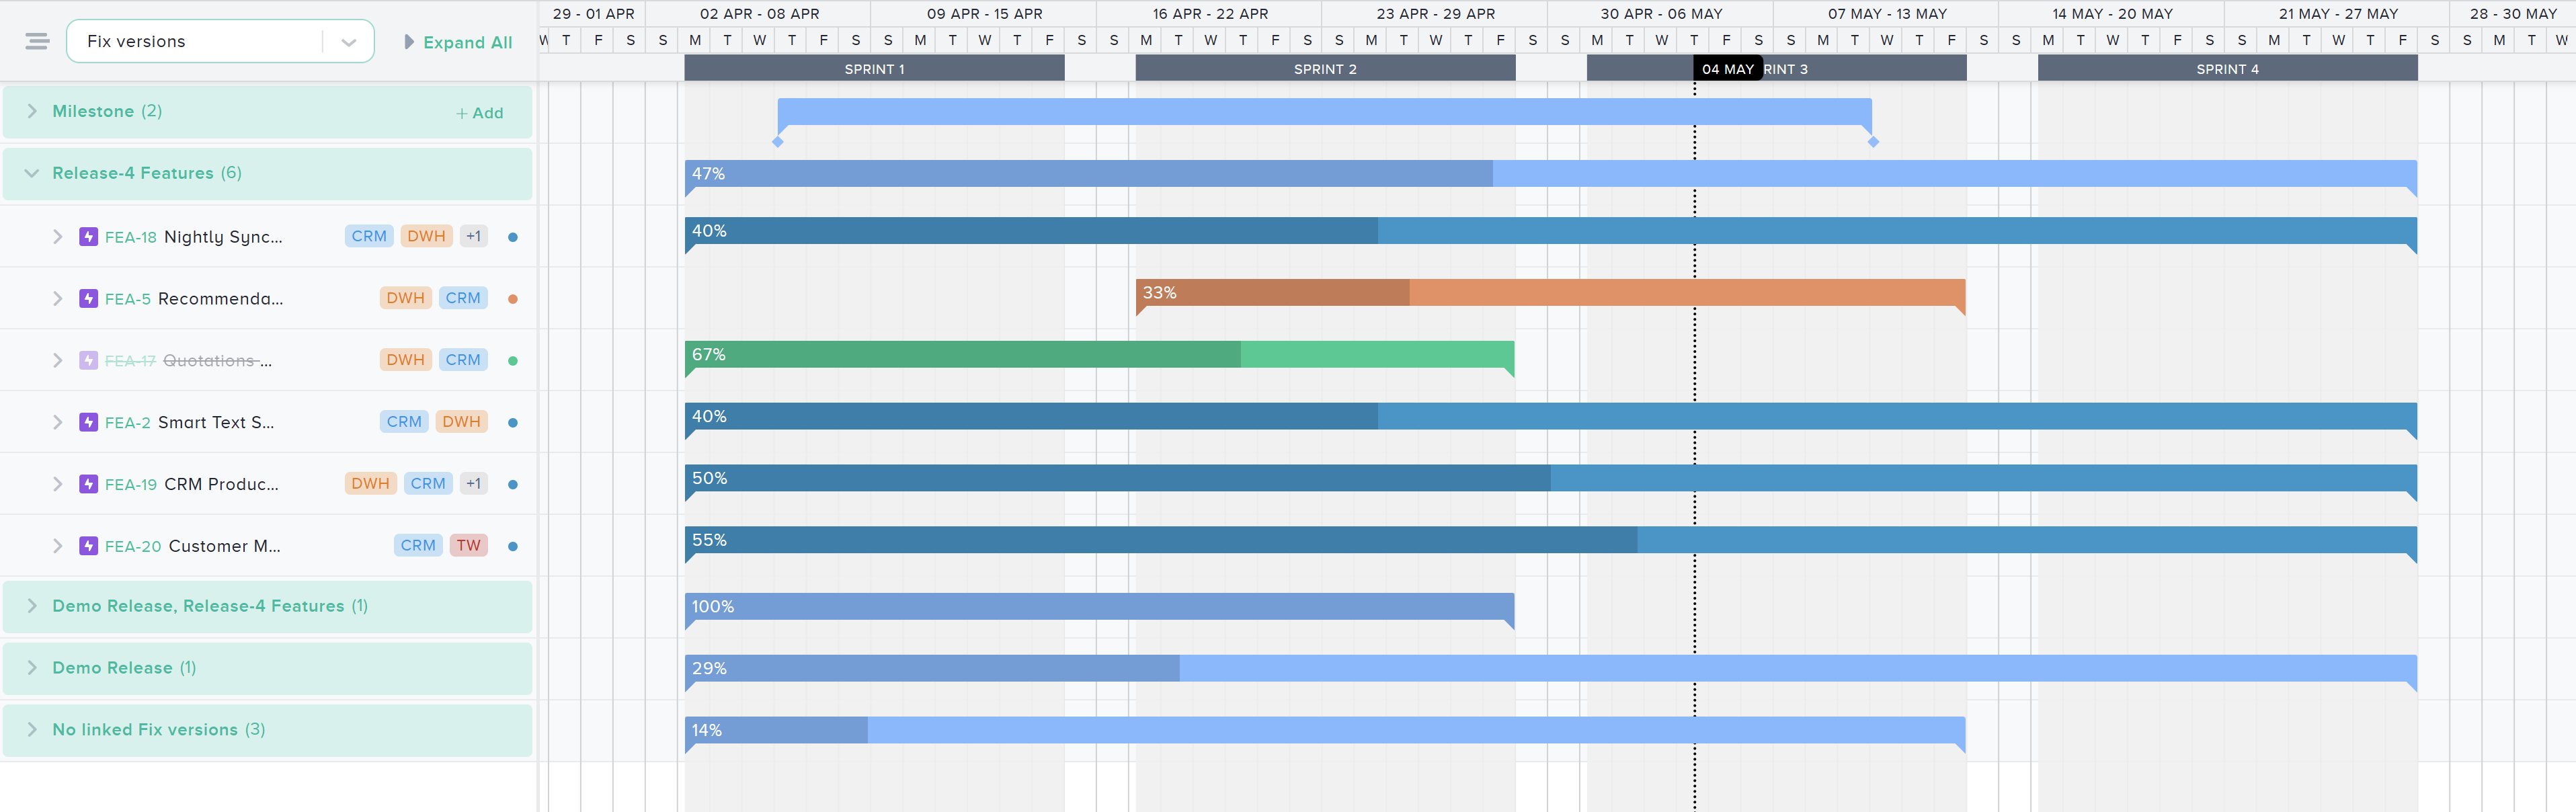
- Additional Fields (Custom Fields)
Tip: If you don’t see these options, go to “Edit Board Settings 🡪 Additional Settings 🡪 Additional Fields” and enable them. Fields enabled for Features/Epics will be accessible. Group by doesn’t use fields configured for Story.
n this example, we have configured “Fix Version” as an additional field, and we are able to view the progress of the features that are linked to each Fix Version. Progress bars at each group level show us the completion of the Fix Version.
For Azure DevOps Board
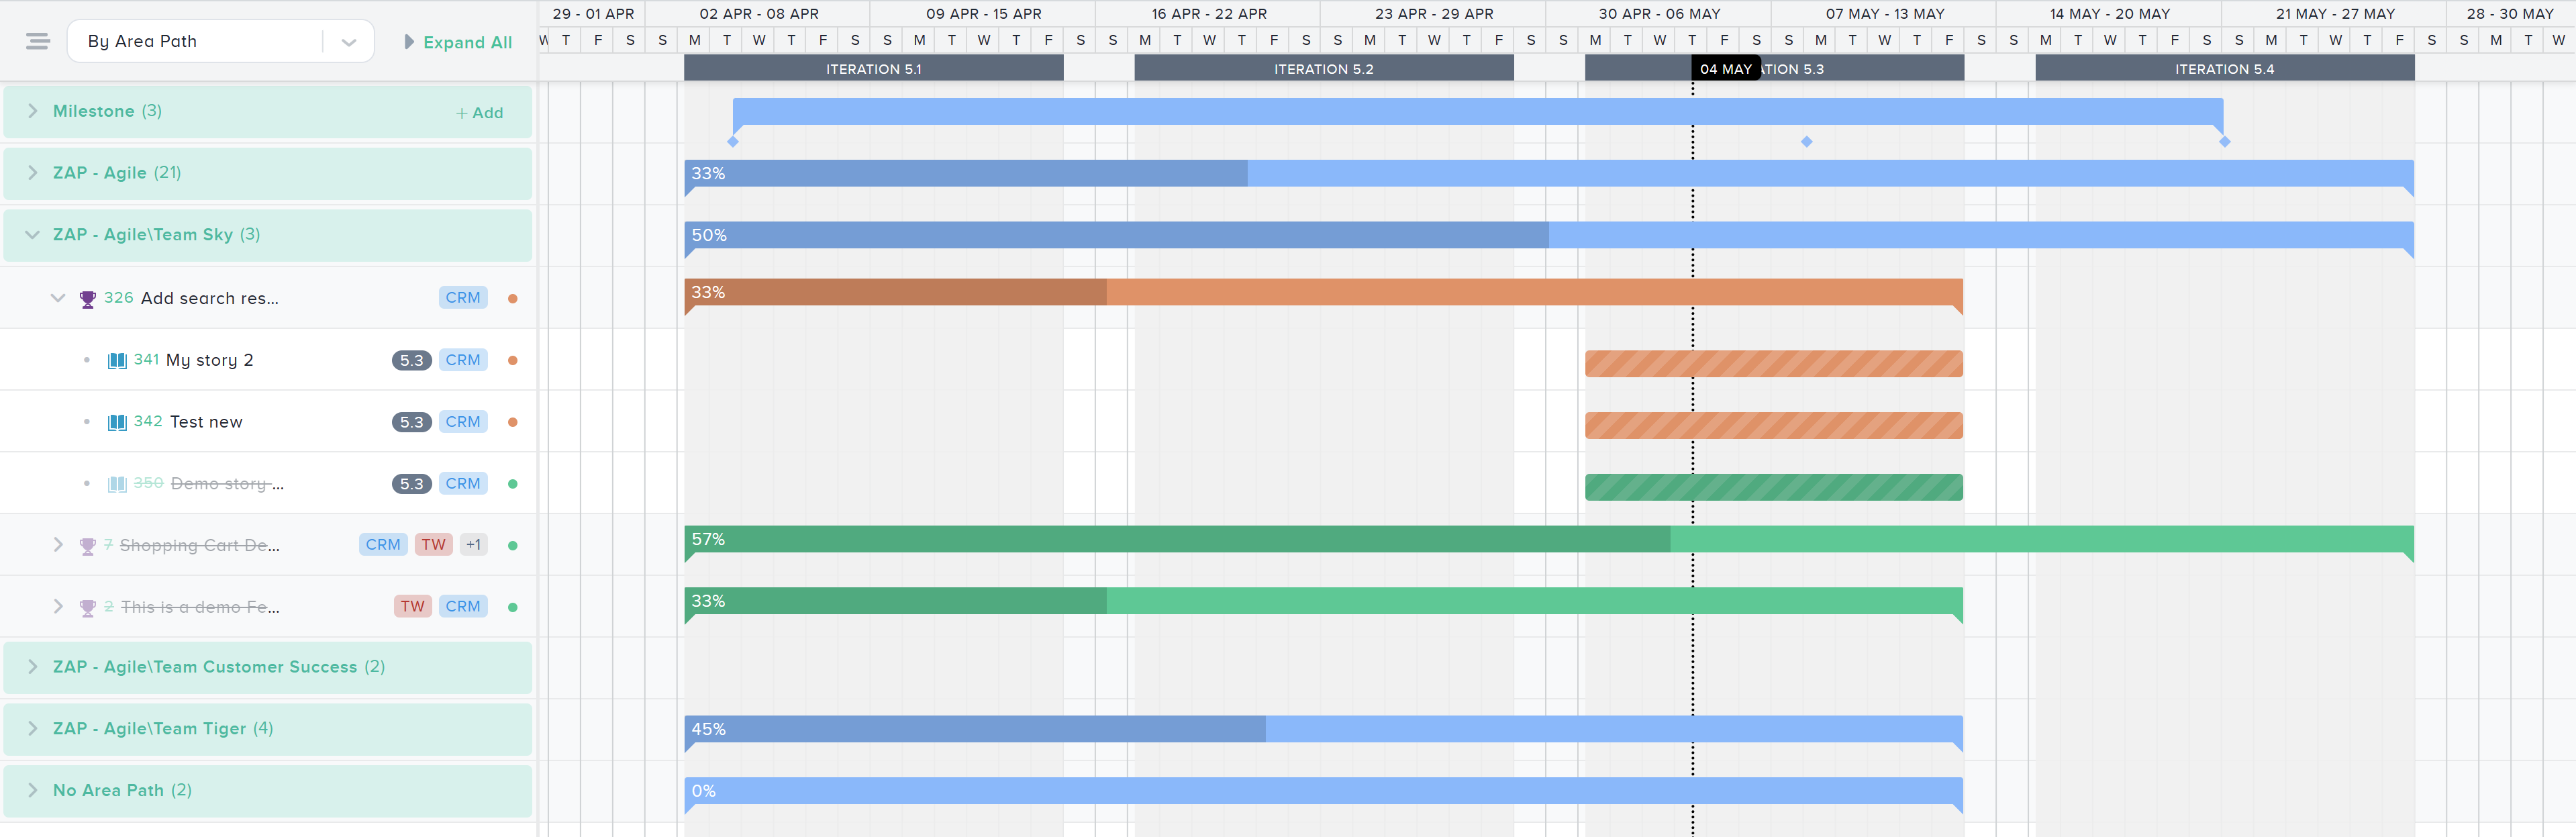
- By AreaPath: Features belonging to each AreaPath will be grouped and shows you combined progress. By expanding each AreaPath, you can view each feature’s progress
- By Parent-Epic: For each feature added to your Kendis board, using the Parent Link, its parent Epic is stored in Kendis as well. This group by options shows you the completion of Parent-Epic based on the features that are in this Program Board.
The following example shows the Group by Data based on “AreaPath”
How to view progress for a specific Sprint?
Progress is shown for all the Sprints on the board. However, you may be interested in the progress of the features for a specific sprint. To achieve this, use the Sprint filter option.
Search 🡪 More Filters 🡪 Sprint 🡪 (Select Sprint)
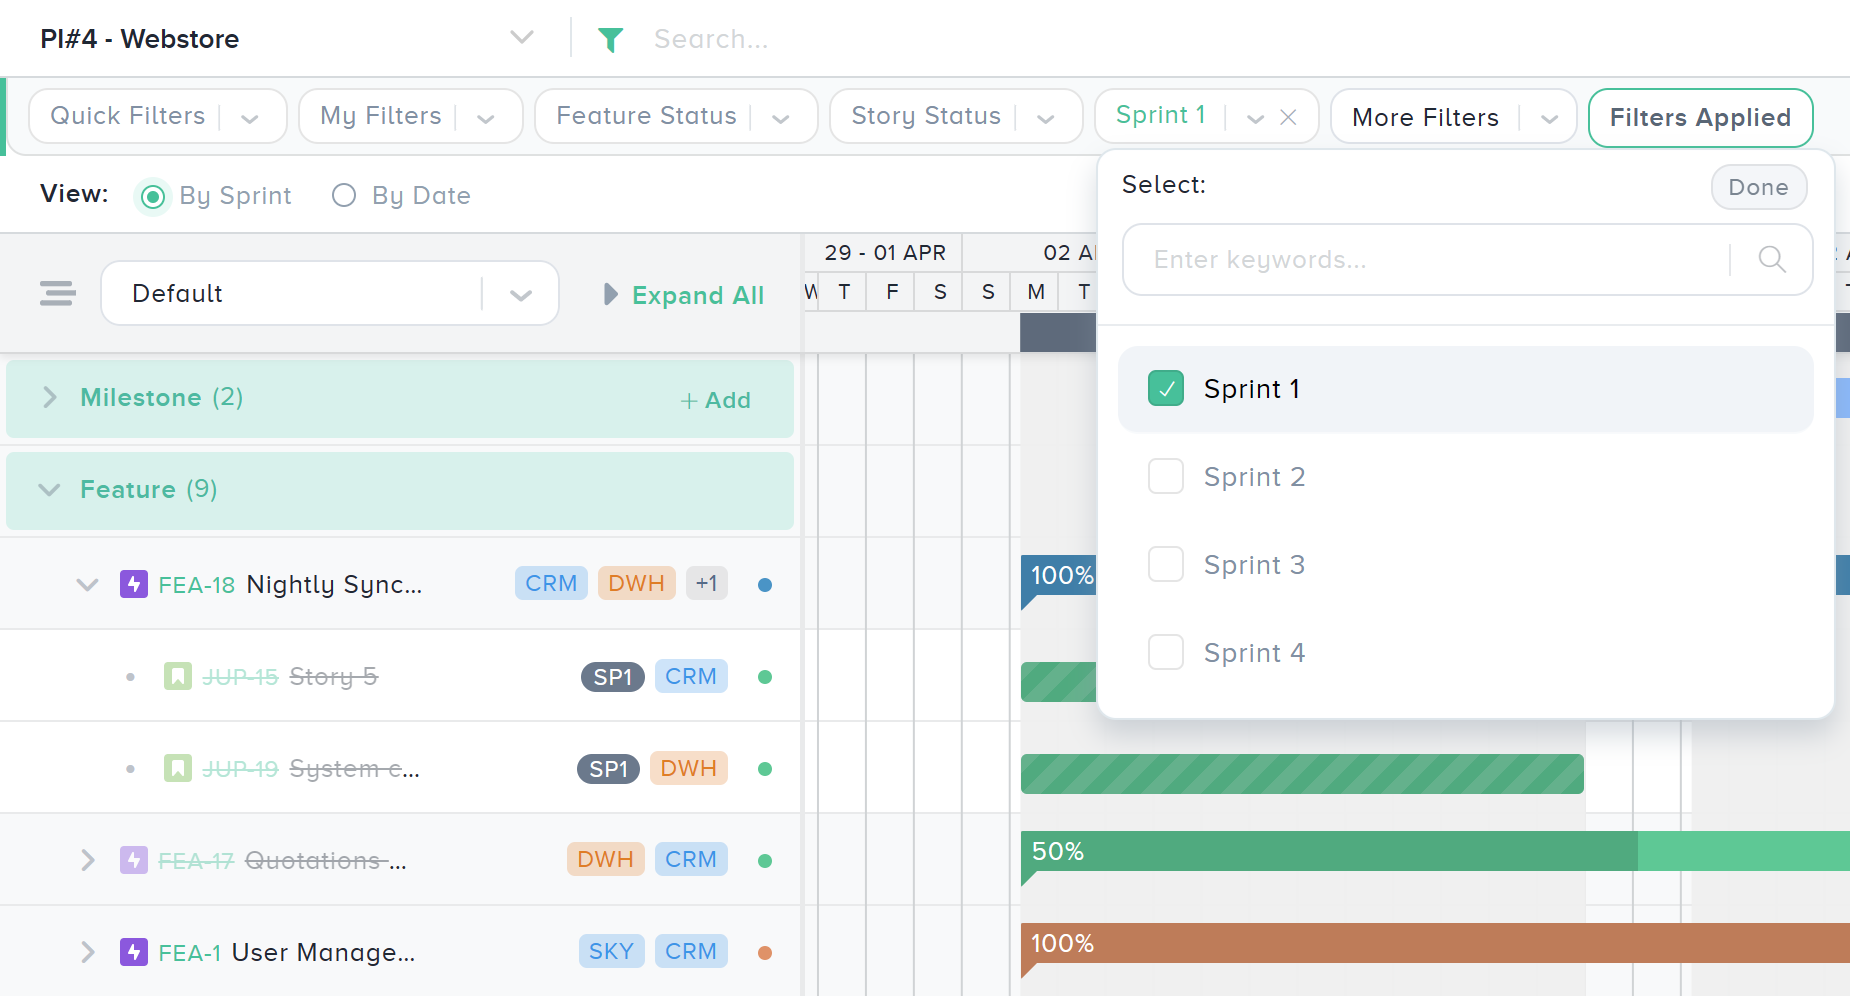
The progress you see on the features will be based on the stories that are in the selected Sprint(s).
How to track the progress of Specific Features?
If you are interested in the progress of specific features, search them by Title or ID, and once you have your list, then save this list as Filter and use that filter for your tracking. The resulting timeline view will only show your selected features.
Is this Read-only View?
No, it is an interactive view where you are able to drag stories across different sprints. You can drag the whole bar and move to different sprints or hold the right-hand side corner and drag it.
To move unplanned stories to the sprints, click on their title on the list and on the modal window, you are able to set the team and sprint.
By Date View, how does it help?
For every planned story, Kendis uses it’s sprint start and end date as the default values. Once you move a story from backlog to a sprint the dates are set automatically. This action of setting dates happens.
- When you move a story from backlog to a sprint. Story will get the start and end dates of the sprint.
- When the story moves from one sprint to another, Kendis only changes the end date of the story, this way, it can be seen when the story actually started and how it progressed into another sprint.
How the By Date view shows the stories and features
The default value of the feature start and end date is based on the Sprints that it has stories in. The story uses start and end dates based on the sprints they have been in.
It is possible to change the date by dragging the corner of a feature or story bar.
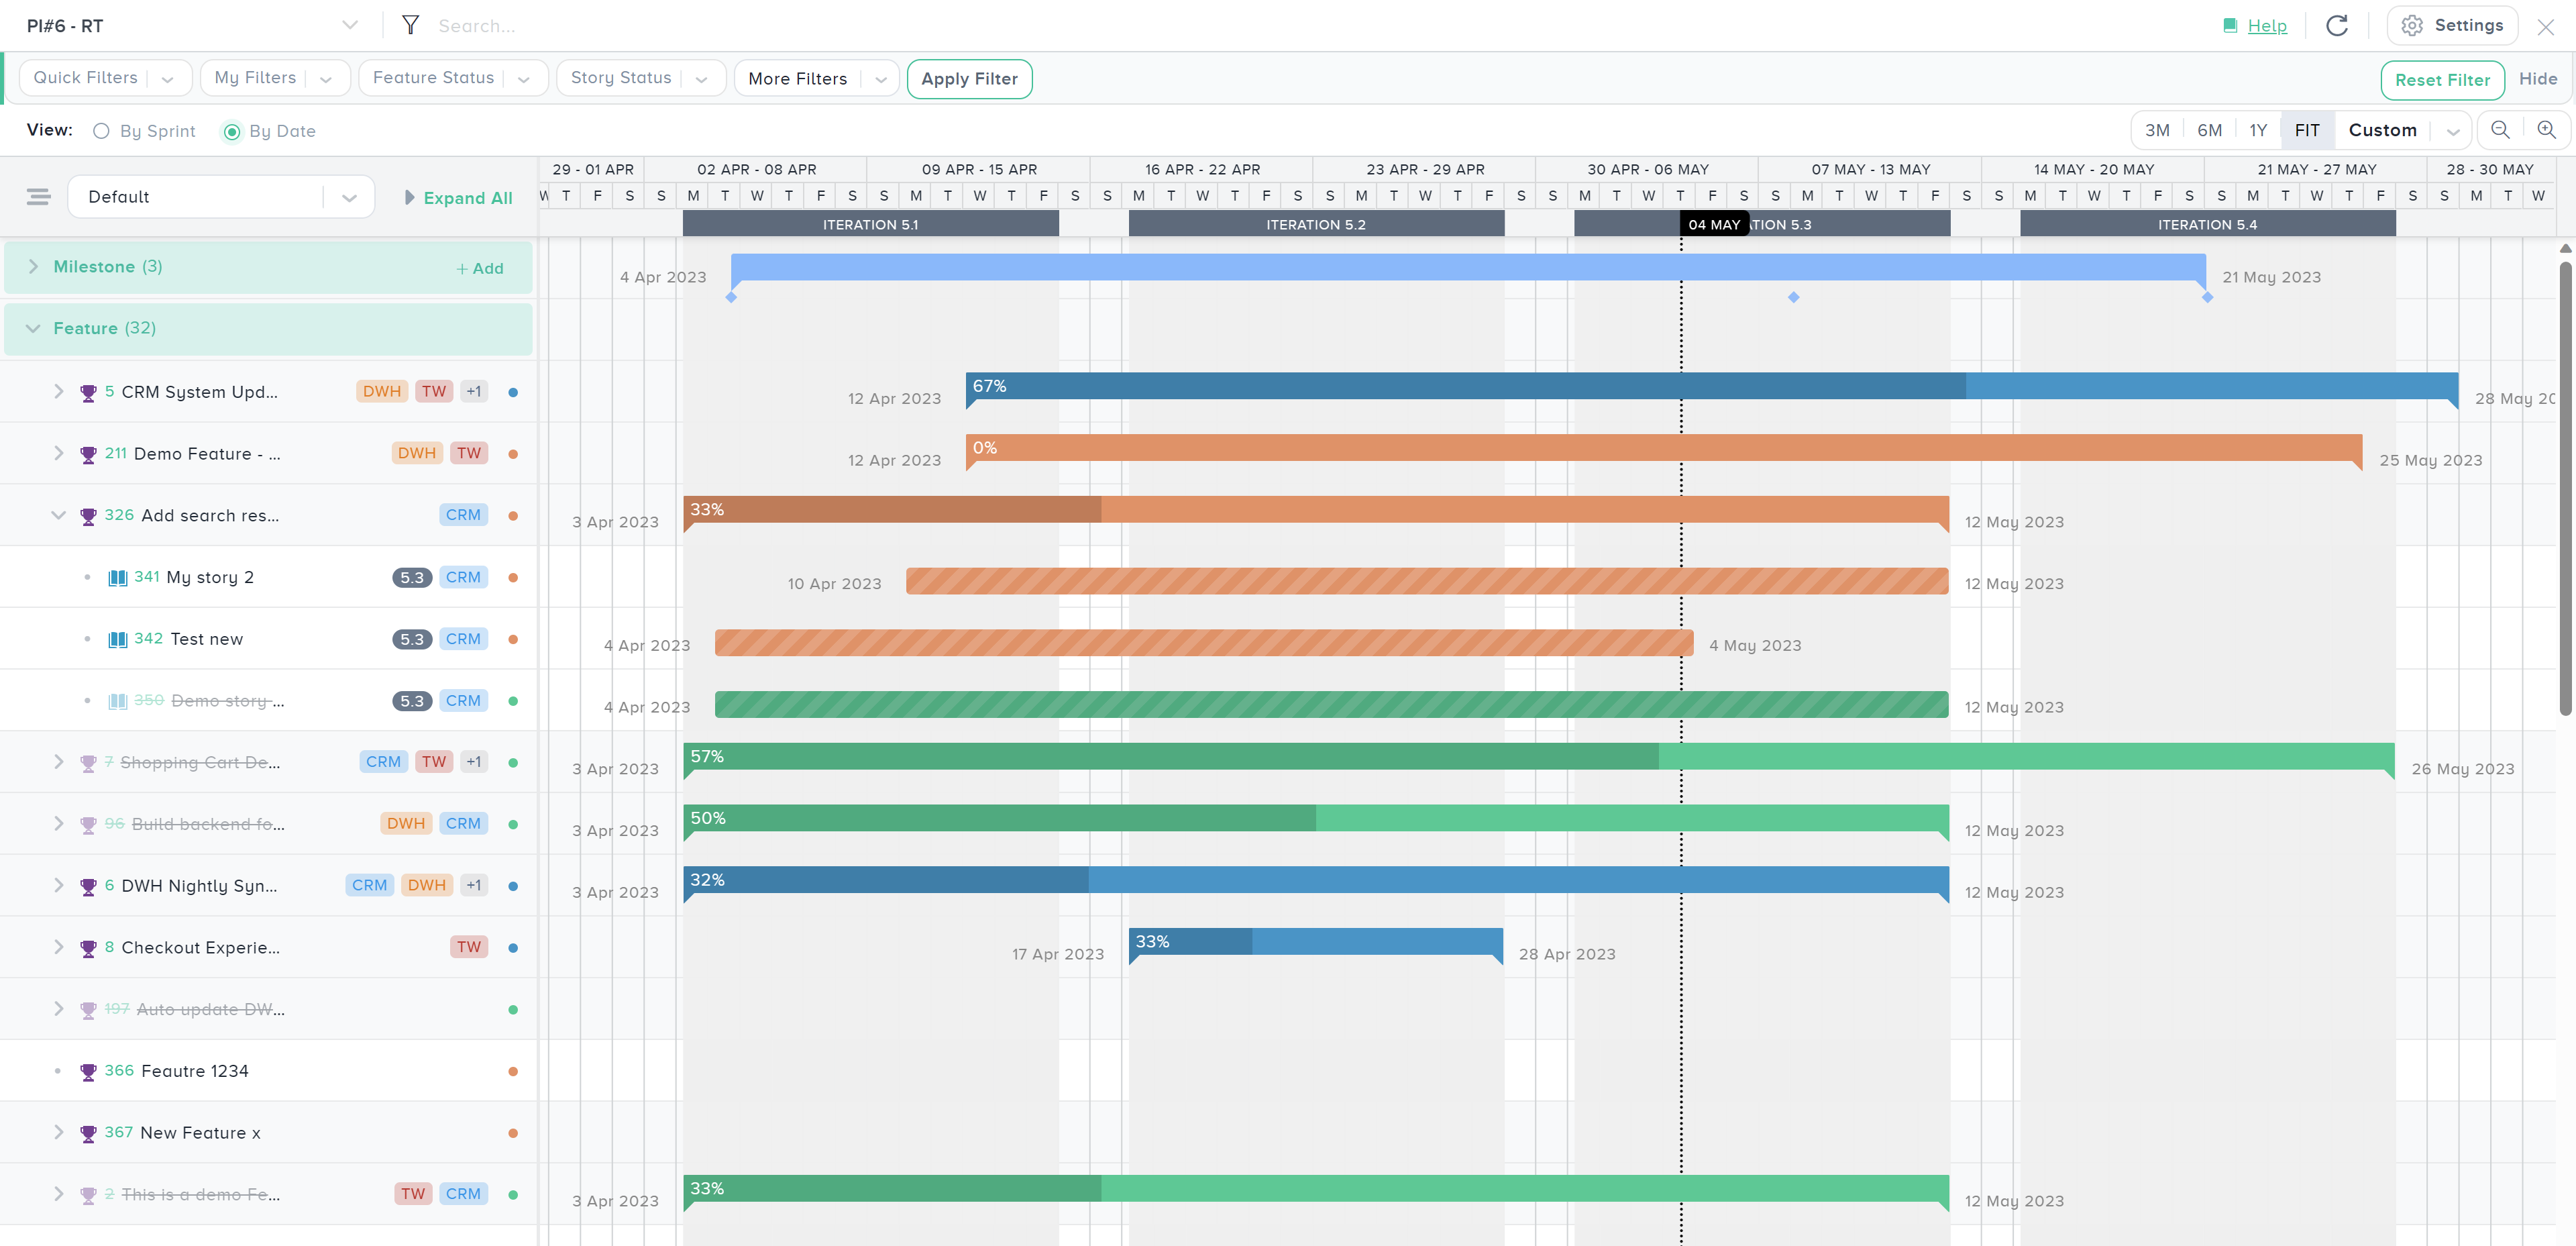
This view is helpful to look at the journey of the stories that have jumped across different sprints because Kendis will not change the start date, you have a longer bar that shows if the stories have moved to multiple different sprints.
Next week we will be publishing another blog about how to use Scrum of Scrums during your PI execution.
For further questions or any feedback, reach out to us at [email protected]