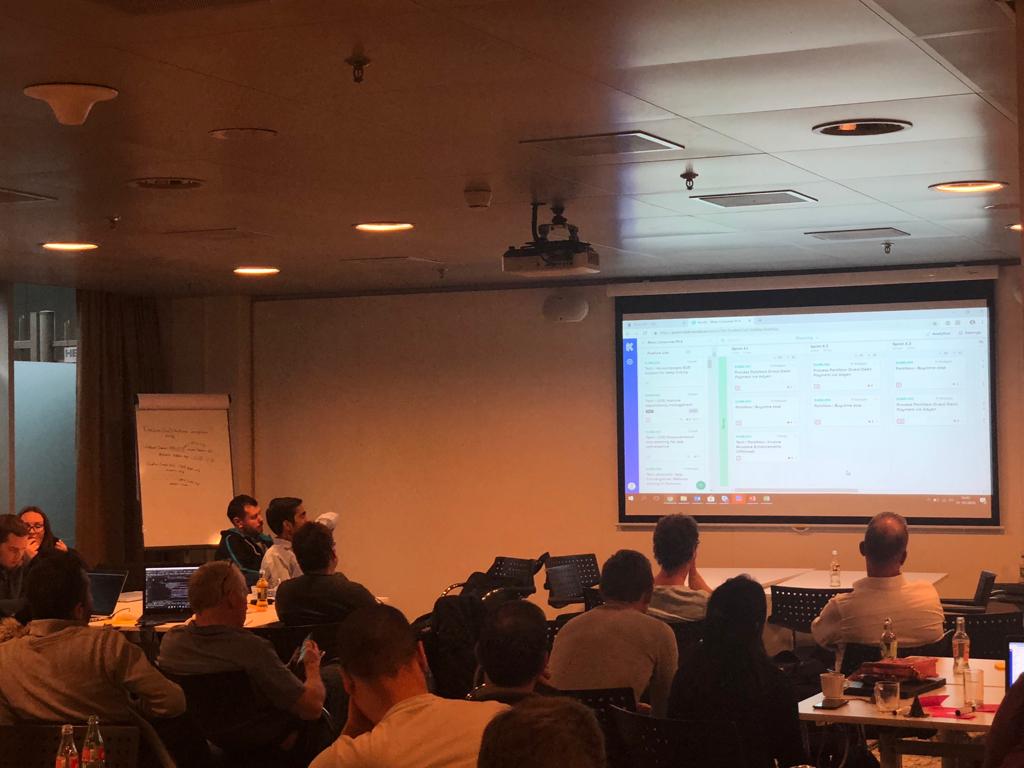
One of the challenges in scaling is maintaining an insight into the actual progression of the value being delivered by multiple teams. There are various options for meetings and ceremonies that provide a holistic view. In the Scaled Agile Framework (SAFe), System Demo is a ceremony that ensures that the core values of the working software have been met.
During the Program Increment (PI), the system demo is an opportunity to provide the organization with a view of the true progression by demonstrating working and a fully integrated software. This will be at the end of an iteration (ideally held after each Sprint), where the business and the other stakeholders have an opportunity to witness the hard effort the teams have made as well as providing feedback.
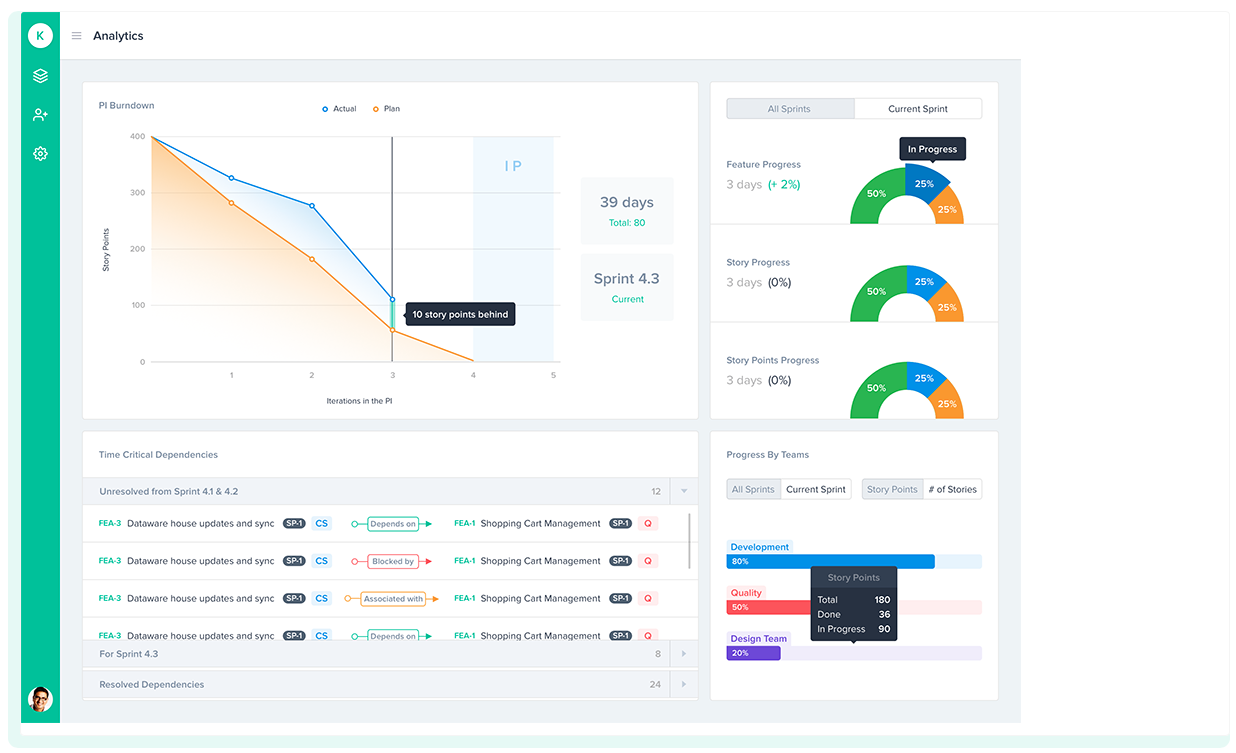
In parallel, the Burndown Chart can also be used anytime during the Program Increment. It is the norm for Agile Scrum Teams to provide their individual Burndown Charts after all, in agile scrum methodology it is one of the most important metrics to gauge the status and progression of the teams.
It is a graphical representation of effort remaining over a period of time. Not only do these charts help teams track their effort, but also assists the scrum masters predict if their teams will be able to achieve their planned target.
Benefits of the Burndown Charts also include:
- A means of communication for stakeholders and the customers to provide feedback
- Visualizing the effort required for the completion of a Release Train
- Enhancing accuracy in estimation
- Predictability of the PI’s
- Displaying the remaining effort at a glance
- Discussing the points for the Inspect and Adapt session
- Observing the variation in points during the PI
- Minimizing risk
- Presenting a glance of the entire PI allowing improved Scope Management.
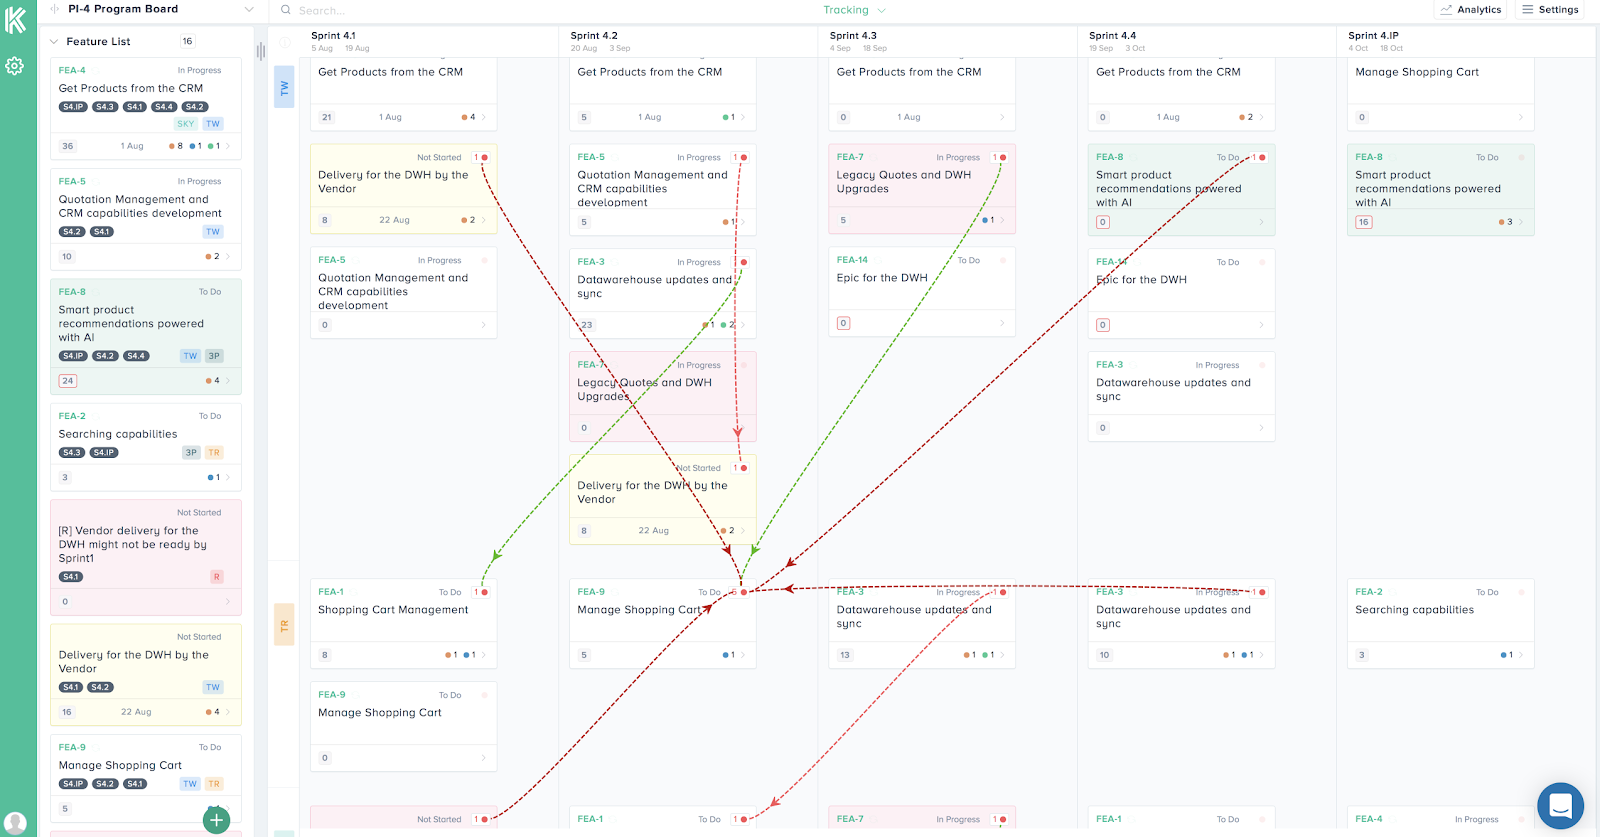
With multiple teams, perhaps in a number of different locations, it becomes difficult to have the immediate overview at the end of each sprint. The amount of effort required in combining the work of all the individual teams progress and translating the information to relevant stakeholders should not trivialized, but yet this is vital.
The PI burndown chart is an invaluable asset to planning and tracking. If used to its full potential, the Burndown Chart assists the organization or program in gaining insights with a more focused view of the work carried out by multiple teams. Research will become easier as would an ability to identify possible gaps or omissions. This would in turn, lend itself to further exchanges of ideas, conceptual thinking and reflecting regularly on how to become a more effective Team of Teams thus fulfilling another important principle of Agile.
Kendis works tirelessly to provide consumers, enterprises, institutions and government organizations with a clearer overview of development and value. We strive to create the best outcomes for our clients and guide our customers on their Agile journey with ingenuity that leads to solutions that are simple, creative and responsible.
Click here to see how Kendis can help your organization.